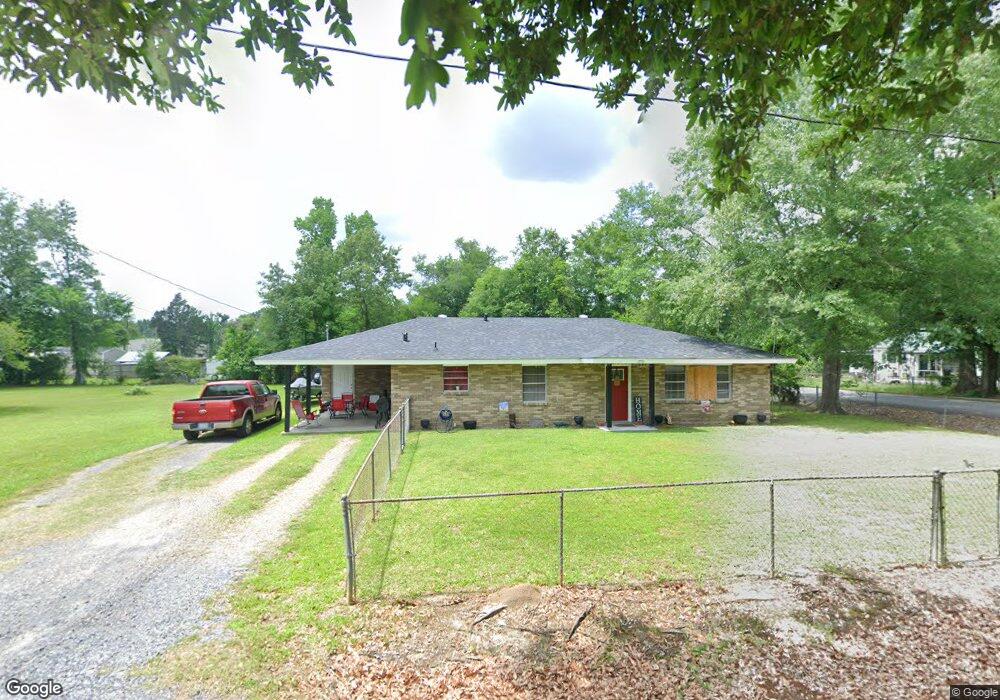
1033 Core Rd Dequincy, LA 70633
3
Beds
2
Baths
1,418
Sq Ft
0.7
Acres Lot
About This Home
This home is located at 1033 Core Rd, Dequincy, LA 70633. 1033 Core Rd is a home located in Calcasieu Parish with nearby schools including DeQuincy Primary School, DeQuincy Elementary School, and DeQuincy Middle School.
Create a Home Valuation Report for This Property
The Home Valuation Report is an in-depth analysis detailing your home's value as well as a comparison with similar homes in the area
Home Values in the Area
Average Home Value in this Area
Tax History
We collect this data history from publicly available records. To have your information removed, we recommend requesting removal directly through your county’s website.
| Year | Tax Paid | Tax Assessment Tax Assessment Total Assessment is a certain percentage of the fair market value that is determined by local assessors to be the total taxable value of land and additions on the property. | Land | Improvement |
|---|---|---|---|---|
| 2024 | $785 | $6,950 | $710 | $6,240 |
| 2023 | $785 | $6,950 | $710 | $6,240 |
| 2022 | $780 | $6,950 | $710 | $6,240 |
| 2021 | $0 | $6,950 | $710 | $6,240 |
| 2020 | $728 | $6,300 | $680 | $5,620 |
| 2019 | $801 | $6,900 | $660 | $6,240 |
| 2018 | $800 | $6,900 | $660 | $6,240 |
| 2017 | $741 | $6,900 | $660 | $6,240 |
| 2016 | $800 | $6,900 | $660 | $6,240 |
| 2015 | $800 | $6,870 | $630 | $6,240 |
Source: Public Records
Map
Nearby Homes
- 0 Kelly St
- 945 Myrtle St
- 808 Oak St
- 1068 Bill Phillips Rd
- TBD Page St
- 202 Gill St
- 803 N Division St
- Tbd N Grand Ave
- 115 Gill St
- 603 Beech St
- 401 Oak St
- 1 Louisiana 27
- 411 Third St
- 0 Red Baggett Rd
- 0 Louisiana 27 Unit 21290062
- 159 Coward Rd
- 110 N Pine St
- 0 Hwy 27 Unit SWL24005037
- 201 W 4th St
- 206 S Front St
Your Personal Tour Guide
Ask me questions while you tour the home.