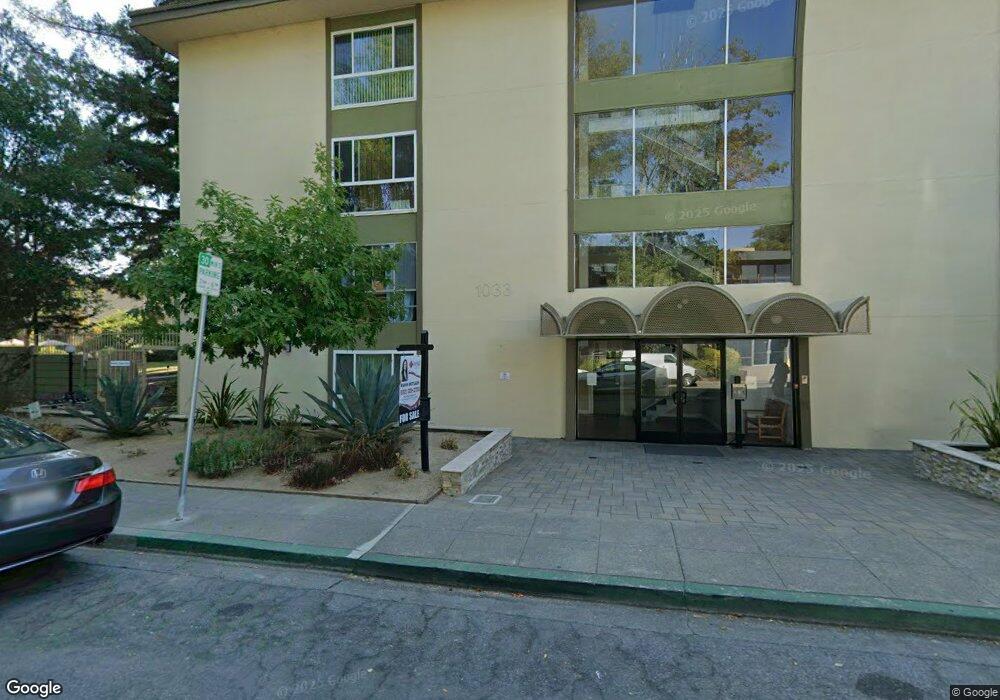
1033 Crestview Dr Unit 109 Mountain View, CA 94040
Cuernavaca NeighborhoodEstimated Value: $760,522 - $826,000
2
Beds
2
Baths
1,140
Sq Ft
$690/Sq Ft
Est. Value
About This Home
This home is located at 1033 Crestview Dr Unit 109, Mountain View, CA 94040 and is currently estimated at $787,131, approximately $690 per square foot. 1033 Crestview Dr Unit 109 is a home located in Santa Clara County with nearby schools including Amy Imai Elementary School, Isaac Newton Graham Middle School, and Mountain View High School.
Ownership History
Date
Name
Owned For
Owner Type
Purchase Details
Closed on
Nov 11, 2005
Sold by
Woolsey Roy B
Bought by
Woolsey Roy B
Current Estimated Value
Create a Home Valuation Report for This Property
The Home Valuation Report is an in-depth analysis detailing your home's value as well as a comparison with similar homes in the area
Home Values in the Area
Average Home Value in this Area
Purchase History
| Date | Buyer | Sale Price | Title Company |
|---|---|---|---|
| Woolsey Roy B | -- | -- |
Source: Public Records
Tax History
| Year | Tax Paid | Tax Assessment Tax Assessment Total Assessment is a certain percentage of the fair market value that is determined by local assessors to be the total taxable value of land and additions on the property. | Land | Improvement |
|---|---|---|---|---|
| 2025 | $2,938 | $234,315 | $70,196 | $164,119 |
| 2024 | $2,938 | $229,721 | $68,820 | $160,901 |
| 2023 | $2,909 | $225,218 | $67,471 | $157,747 |
| 2022 | $2,901 | $220,803 | $66,149 | $154,654 |
| 2021 | $2,834 | $216,474 | $64,852 | $151,622 |
| 2020 | $2,837 | $214,256 | $64,188 | $150,068 |
| 2019 | $2,727 | $210,056 | $62,930 | $147,126 |
| 2018 | $2,711 | $205,939 | $61,697 | $144,242 |
| 2017 | $2,608 | $201,902 | $60,488 | $141,414 |
| 2016 | $2,476 | $197,944 | $59,302 | $138,642 |
| 2015 | $2,410 | $194,972 | $58,412 | $136,560 |
| 2014 | $2,391 | $191,153 | $57,268 | $133,885 |
Source: Public Records
Map
Nearby Homes
- 1289 Morningside Dr
- 621 Charmain Cir
- 918 Mockingbird Ln
- 13411 Pastel Ln
- 1155 W Mc Kinley Ave
- 248 S Bernardo Ave
- 1096 W Mckinley Ave
- 1248 Cortez Dr
- 191 E El Camino Real Unit 138
- 191 E El Camino Real Unit 260
- 191 E El Camino Real Unit 213
- 191 E El Camino Real Unit 146
- 2524 Sun Mor Ave
- 395 Martens Ave
- 411 Hedgerow Ct
- 433 Sylvan Ave
- 433 Sylvan Ave Unit 120
- 433 Sylvan Ave Unit 84
- 433 Sylvan Ave Unit 134
- 377 S Mary Ave
- 1033 Crestview Dr Unit 216
- 1033 Crestview Dr Unit 218
- 1033 Crestview Dr Unit 307
- 1033 Crestview Dr Unit 301
- 1033 Crestview Dr Unit 103
- 1033 Crestview Dr Unit 102
- 1033 Crestview Dr Unit 101
- 1033 Crestview Dr Unit 203
- 1033 Crestview Dr Unit 202
- 1033 Crestview Dr Unit 201
- 1033 Crestview Dr Unit 118
- 1033 Crestview Dr Unit 116
- 1033 Crestview Dr Unit 114
- 1033 Crestview Dr Unit 112
- 1033 Crestview Dr Unit 111
- 1033 Crestview Dr Unit 110
- 1033 Crestview Dr Unit 108
- 1033 Crestview Dr Unit 107
- 1033 Crestview Dr Unit 106
- 1033 Crestview Dr Unit 105
Your Personal Tour Guide
Ask me questions while you tour the home.