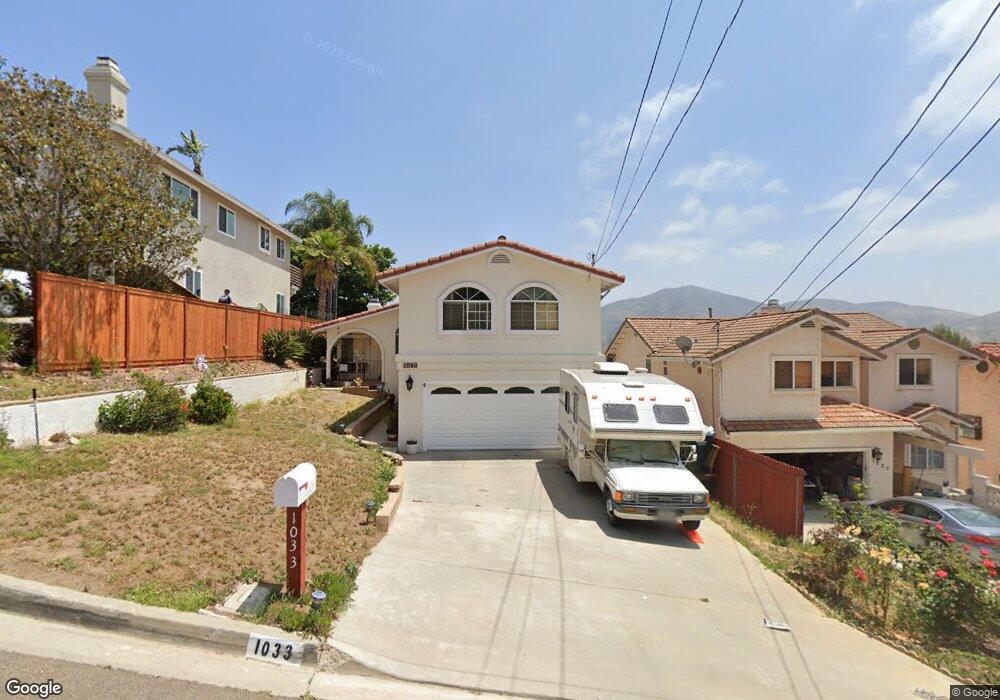
1033 Cuyamaca Ave Spring Valley, CA 91977
Estimated Value: $808,000 - $861,000
4
Beds
3
Baths
1,978
Sq Ft
$422/Sq Ft
Est. Value
About This Home
This home is located at 1033 Cuyamaca Ave, Spring Valley, CA 91977 and is currently estimated at $834,890, approximately $422 per square foot. 1033 Cuyamaca Ave is a home located in San Diego County with nearby schools including Science, Technology, Engineering, Arts, And Math Academy, Sweetwater Springs Elementary School, and Monte Vista High School.
Ownership History
Date
Name
Owned For
Owner Type
Purchase Details
Closed on
Apr 12, 2013
Sold by
Hernandez Adrian A and Hernandez Cristina H
Bought by
Hernandez Adrian and Hrnandez Cristina H
Current Estimated Value
Home Financials for this Owner
Home Financials are based on the most recent Mortgage that was taken out on this home.
Original Mortgage
$264,000
Outstanding Balance
$186,685
Interest Rate
3.51%
Mortgage Type
New Conventional
Estimated Equity
$648,205
Purchase Details
Closed on
Aug 12, 2011
Sold by
Fulcher Sara L
Bought by
Hernandez Adrian A and Hernandez Cristina H
Home Financials for this Owner
Home Financials are based on the most recent Mortgage that was taken out on this home.
Original Mortgage
$263,155
Interest Rate
4.16%
Mortgage Type
FHA
Purchase Details
Closed on
Dec 8, 2010
Sold by
George Stephen R and Fulcher Sara L
Bought by
Fulcher Sara L
Purchase Details
Closed on
Oct 10, 2006
Sold by
Fulcher Sara L
Bought by
George Stephen R and Fulcher Sara L
Home Financials for this Owner
Home Financials are based on the most recent Mortgage that was taken out on this home.
Original Mortgage
$486,400
Interest Rate
1%
Mortgage Type
Negative Amortization
Purchase Details
Closed on
Aug 30, 2006
Sold by
George Stephen R
Bought by
Fulcher Sara L
Home Financials for this Owner
Home Financials are based on the most recent Mortgage that was taken out on this home.
Original Mortgage
$486,400
Interest Rate
1%
Mortgage Type
Negative Amortization
Purchase Details
Closed on
Aug 30, 2004
Sold by
Coles Donald L and Coles Carol L
Bought by
George Stephen R and Fulcher Sara L
Home Financials for this Owner
Home Financials are based on the most recent Mortgage that was taken out on this home.
Original Mortgage
$450,000
Interest Rate
5.77%
Mortgage Type
Unknown
Purchase Details
Closed on
Jan 8, 1998
Sold by
Oleary Neil J and Oleary Tiffany M
Bought by
Coles Donald L and Coles Carol L
Home Financials for this Owner
Home Financials are based on the most recent Mortgage that was taken out on this home.
Original Mortgage
$187,975
Interest Rate
7.14%
Mortgage Type
VA
Purchase Details
Closed on
Jun 8, 1995
Sold by
Cliffs Quality Construction Inc
Bought by
Oleary Neil J and Oleary Tiffany M
Home Financials for this Owner
Home Financials are based on the most recent Mortgage that was taken out on this home.
Original Mortgage
$149,600
Interest Rate
7.88%
Create a Home Valuation Report for This Property
The Home Valuation Report is an in-depth analysis detailing your home's value as well as a comparison with similar homes in the area
Home Values in the Area
Average Home Value in this Area
Purchase History
| Date | Buyer | Sale Price | Title Company |
|---|---|---|---|
| Hernandez Adrian | -- | Lawyers Title | |
| Hernandez Adrian A | $270,000 | American Coast Title | |
| Fulcher Sara L | -- | None Available | |
| George Stephen R | -- | Accommodation | |
| Fulcher Sara L | -- | United Title | |
| George Stephen R | $500,000 | Commonwealth Land Title Co | |
| Coles Donald L | $182,500 | First American Title Co | |
| Oleary Neil J | $188,000 | Orange Coast Title Company |
Source: Public Records
Mortgage History
| Date | Status | Borrower | Loan Amount |
|---|---|---|---|
| Open | Hernandez Adrian | $264,000 | |
| Previous Owner | Hernandez Adrian A | $263,155 | |
| Previous Owner | Fulcher Sara L | $486,400 | |
| Previous Owner | George Stephen R | $450,000 | |
| Previous Owner | Coles Donald L | $187,975 | |
| Previous Owner | Oleary Neil J | $149,600 | |
| Closed | Oleary Neil J | $149,600 | |
| Closed | George Stephen R | $50,000 |
Source: Public Records
Tax History
| Year | Tax Paid | Tax Assessment Tax Assessment Total Assessment is a certain percentage of the fair market value that is determined by local assessors to be the total taxable value of land and additions on the property. | Land | Improvement |
|---|---|---|---|---|
| 2025 | $4,556 | $339,121 | $119,318 | $219,803 |
| 2024 | $4,556 | $332,473 | $116,979 | $215,494 |
| 2023 | $4,412 | $325,955 | $114,686 | $211,269 |
| 2022 | $4,338 | $319,565 | $112,438 | $207,127 |
| 2021 | $4,298 | $313,300 | $110,234 | $203,066 |
| 2020 | $4,126 | $310,088 | $109,104 | $200,984 |
| 2019 | $4,065 | $304,009 | $106,965 | $197,044 |
| 2018 | $3,941 | $298,049 | $104,868 | $193,181 |
| 2017 | $831 | $292,206 | $102,812 | $189,394 |
| 2016 | $3,705 | $286,478 | $100,797 | $185,681 |
| 2015 | $3,675 | $282,175 | $99,283 | $182,892 |
| 2014 | $3,609 | $276,649 | $97,339 | $179,310 |
Source: Public Records
Map
Nearby Homes
- 1234 Sangamon Ave
- 1405 Cuyamaca Ave
- 10137 Greenleaf Rd
- 1408 Coronado Ave Unit 35
- 9838 Ivanho St
- 9902 Jamacha Blvd Unit 81
- 9902 Jamacha Blvd Unit 133
- 9902 Jamacha Blvd Unit 24
- 9902 Jamacha Blvd Unit 78
- 9902 Jamacha Blvd Unit SPC 7
- 9902 Jamacha Blvd Unit 13
- 1068 Fairhill Terrace
- 1635 San Bernardino Ave Unit 139.05
- 952 Galopago St
- 1644 Cuyamaca Ave
- 9726 Ivanho St
- 10496 Celestial Waters Dr
- 1621 Coronado Ave
- 1621 Portola Ave
- 9745 Saint George St
- 1027 Cuyamaca Ave
- 1103 Cuyamaca Ave
- 1019 Cuyamaca Ave
- 1107 Cuyamaca Ave
- 1032 Sangamon Ave
- 1024 Sangamon Ave
- 1102 Sangamon Ave
- 1015 Cuyamaca Ave
- 1111 Cuyamaca Ave
- 1020 Sangamon Ave
- 1106 Sangamon Ave
- 1046 Cuyamaca Ave
- 1104 Cuyamaca Ave
- 9872 Apple St
- 1016 Sangamon Ave
- 1112 Sangamon Ave
- 1011 Cuyamaca Ave
- 1117 Cuyamaca Ave
- 1108 Cuyamaca Ave
- 9868 Apple St
Your Personal Tour Guide
Ask me questions while you tour the home.