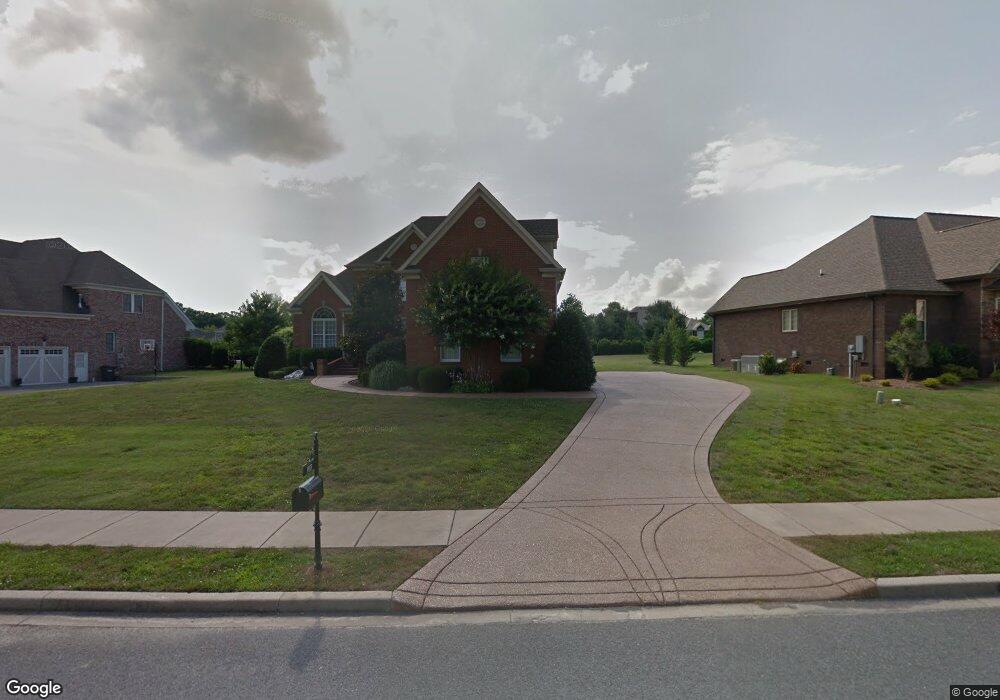
1033 Dorset Dr Hendersonville, TN 37075
Estimated Value: $712,506 - $799,000
--
Bed
4
Baths
2,737
Sq Ft
$280/Sq Ft
Est. Value
About This Home
This home is located at 1033 Dorset Dr, Hendersonville, TN 37075 and is currently estimated at $765,627, approximately $279 per square foot. 1033 Dorset Dr is a home located in Sumner County with nearby schools including Beech Elementary School, T.W. Hunter Middle School, and Beech High School.
Ownership History
Date
Name
Owned For
Owner Type
Purchase Details
Closed on
Aug 18, 2006
Sold by
Bank Of New York
Bought by
Wilkins Jerry B and Wilkins Lori
Current Estimated Value
Home Financials for this Owner
Home Financials are based on the most recent Mortgage that was taken out on this home.
Original Mortgage
$256,000
Outstanding Balance
$152,946
Interest Rate
6.67%
Mortgage Type
Unknown
Estimated Equity
$612,682
Purchase Details
Closed on
Feb 9, 2006
Sold by
Henderson Michael J
Bought by
Bank Of New York and Cwabs Inc Asset Backed Certificates Seri
Purchase Details
Closed on
Apr 4, 2005
Sold by
Large Gene
Bought by
Henderson Michael J
Home Financials for this Owner
Home Financials are based on the most recent Mortgage that was taken out on this home.
Original Mortgage
$327,600
Interest Rate
8.65%
Mortgage Type
New Conventional
Create a Home Valuation Report for This Property
The Home Valuation Report is an in-depth analysis detailing your home's value as well as a comparison with similar homes in the area
Home Values in the Area
Average Home Value in this Area
Purchase History
| Date | Buyer | Sale Price | Title Company |
|---|---|---|---|
| Wilkins Jerry B | $320,000 | Resource Title Of Tennessee | |
| Bank Of New York | $349,932 | None Available | |
| Henderson Michael J | $409,500 | Serenity Title & Escrow Llc |
Source: Public Records
Mortgage History
| Date | Status | Borrower | Loan Amount |
|---|---|---|---|
| Open | Wilkins Jerry B | $256,000 | |
| Previous Owner | Henderson Michael J | $327,600 | |
| Closed | Henderson Michael J | $81,900 |
Source: Public Records
Tax History Compared to Growth
Tax History
| Year | Tax Paid | Tax Assessment Tax Assessment Total Assessment is a certain percentage of the fair market value that is determined by local assessors to be the total taxable value of land and additions on the property. | Land | Improvement |
|---|---|---|---|---|
| 2024 | $2,560 | $180,125 | $37,500 | $142,625 |
| 2023 | $2,793 | $124,025 | $24,750 | $99,275 |
| 2022 | $2,805 | $124,025 | $24,750 | $99,275 |
| 2021 | $2,805 | $124,025 | $24,750 | $99,275 |
| 2020 | $2,805 | $124,025 | $24,750 | $99,275 |
| 2019 | $2,805 | $0 | $0 | $0 |
| 2018 | $2,188 | $0 | $0 | $0 |
| 2017 | $2,188 | $0 | $0 | $0 |
| 2016 | $2,188 | $0 | $0 | $0 |
| 2015 | -- | $0 | $0 | $0 |
| 2014 | -- | $0 | $0 | $0 |
Source: Public Records
Map
Nearby Homes
- 1043 Dorset Dr
- 1032 Luxborough Dr
- 2712 Long Hollow Pike
- 1007 Newmans Trail
- 1016 Luxborough Dr
- 210 the Hollows Ct
- 967 Luxborough Dr
- 1019 Kidron Way
- 588 Gingerwood Ln
- 1206 Newmans Trail
- 1111 Stirlingshire Dr
- 1022 Tower Hill Ln
- 2595 Long Hollow Pike
- 1002 W Stirling Ct
- 1003 Thistle Ct
- 820 Westchester Cir
- 832 Westchester Cir
- 814 Westchester Cir
- 810 Westchester Cir
- Kingfisher Plan at Durham Farms
- 1031 Dorset Dr
- 1035 Dorset Dr
- 1031 Heathrow Ln
- 1029 Dorset Dr
- 1029 Heathrow Ln
- 1036 Dorset Dr
- 1033 Heathrow Dr
- 1039 Dorset Dr
- 1027 Dorset Dr
- 1027 Heathrow Dr
- 1038 Dorset Dr
- 1027 Heathrow Ln
- 1035 Heathrow Ln
- 113 Dorset Dr
- 1030 Dorset Dr
- 1035 Heathrow Dr
- 1040 Dorset Dr
- 1041 Dorset Dr
- 128 Heathrow
- 1025 Dorset Dr