Estimated Value: $74,000 - $113,000
2
Beds
1
Bath
1,537
Sq Ft
$57/Sq Ft
Est. Value
About This Home
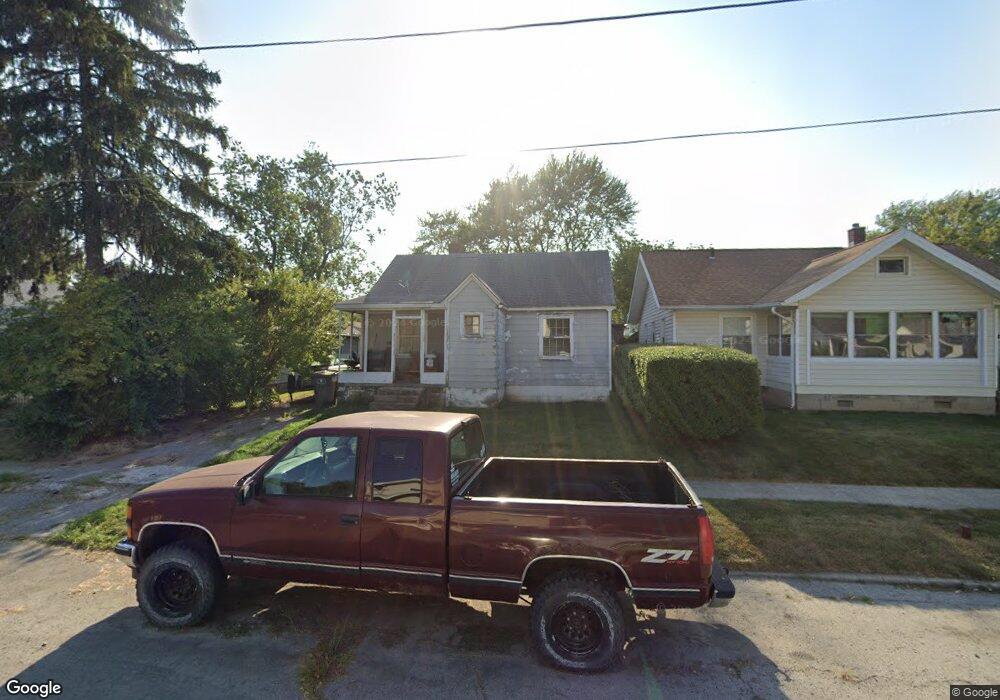
This home is located at 1033 N Central Ave, Lima, OH 45801 and is currently estimated at $87,620, approximately $57 per square foot. 1033 N Central Ave is a home located in Allen County with nearby schools including Independence Elementary School, Lima North Middle School, and Lima West Middle School.
Ownership History
Date
Name
Owned For
Owner Type
Purchase Details
Closed on
Feb 28, 2005
Sold by
Pittman Kenneth R
Bought by
Pittman Jesse O
Current Estimated Value
Home Financials for this Owner
Home Financials are based on the most recent Mortgage that was taken out on this home.
Original Mortgage
$42,750
Outstanding Balance
$21,817
Interest Rate
5.71%
Mortgage Type
Future Advance Clause Open End Mortgage
Estimated Equity
$65,803
Purchase Details
Closed on
Jan 24, 2000
Sold by
Kistler Duane K
Bought by
Johnston James R
Home Financials for this Owner
Home Financials are based on the most recent Mortgage that was taken out on this home.
Original Mortgage
$34,400
Interest Rate
10.1%
Mortgage Type
New Conventional
Purchase Details
Closed on
Feb 27, 1996
Sold by
Kistler Norman
Bought by
Kistler Duane and Kistler Debra
Purchase Details
Closed on
Mar 30, 1992
Bought by
Kistler Norman S
Create a Home Valuation Report for This Property
The Home Valuation Report is an in-depth analysis detailing your home's value as well as a comparison with similar homes in the area
Purchase History
| Date | Buyer | Sale Price | Title Company |
|---|---|---|---|
| Pittman Jesse O | $45,000 | None Available | |
| Johnston James R | $43,000 | -- | |
| Kistler Duane | $17,516 | -- | |
| Kistler Norman S | $15,500 | -- |
Source: Public Records
Mortgage History
| Date | Status | Borrower | Loan Amount |
|---|---|---|---|
| Open | Pittman Jesse O | $42,750 | |
| Previous Owner | Johnston James R | $34,400 |
Source: Public Records
Tax History
| Year | Tax Paid | Tax Assessment Tax Assessment Total Assessment is a certain percentage of the fair market value that is determined by local assessors to be the total taxable value of land and additions on the property. | Land | Improvement |
|---|---|---|---|---|
| 2024 | $700 | $17,860 | $2,980 | $14,880 |
| 2023 | $647 | $14,080 | $2,350 | $11,730 |
| 2022 | $642 | $14,080 | $2,350 | $11,730 |
| 2021 | $679 | $14,080 | $2,350 | $11,730 |
| 2020 | $724 | $13,450 | $2,280 | $11,170 |
| 2019 | $724 | $13,450 | $2,280 | $11,170 |
| 2018 | $727 | $13,450 | $2,280 | $11,170 |
| 2017 | $727 | $13,450 | $2,280 | $11,170 |
| 2016 | $659 | $13,450 | $2,280 | $11,170 |
| 2015 | $604 | $13,450 | $2,280 | $11,170 |
| 2014 | $604 | $12,110 | $2,240 | $9,870 |
| 2013 | $589 | $12,110 | $2,240 | $9,870 |
Source: Public Records
Map
Nearby Homes
- 919 N Main St
- 922 N Jefferson St
- 735 N Elizabeth St
- 1435 N Central Ave
- 316 Ewing Ave
- 1021 N McDonel St
- 406 Ewing Ave
- 616-616.5 N Elizabeth St
- 557 W Ashton Ave
- 576 W Ashton Ave
- 812 Christopher Dr
- 207 W Lane Ave
- 934 N Metcalf St
- 416 Hazel Ave
- 435 Marian Ave
- 608 W O'Connor Ave
- 635 W Ashton Ave
- 645 W O'Connor Ave
- 1212 Virginia Ave
- 1889 N Metcalf St
- 1031 N Central Ave
- 1035 N Central Ave
- 1025 N Central Ave
- 1039 N Central Ave
- 1023 N Central Ave
- 1040 N Union St
- 1034 N Union St
- 1044 N Union St
- 1041 N Central Ave
- 1021 N Central Ave
- 1028 N Union St
- 1030 N Central Ave
- 1028 N Central Ave
- 1052 N Union St
- 1032 N Central Ave
- 1026 N Central Ave
- 1034 N Central Ave
- 1019 N Central Ave
- 1054 N Union St
- 1024 N Central Ave
Your Personal Tour Guide
Ask me questions while you tour the home.