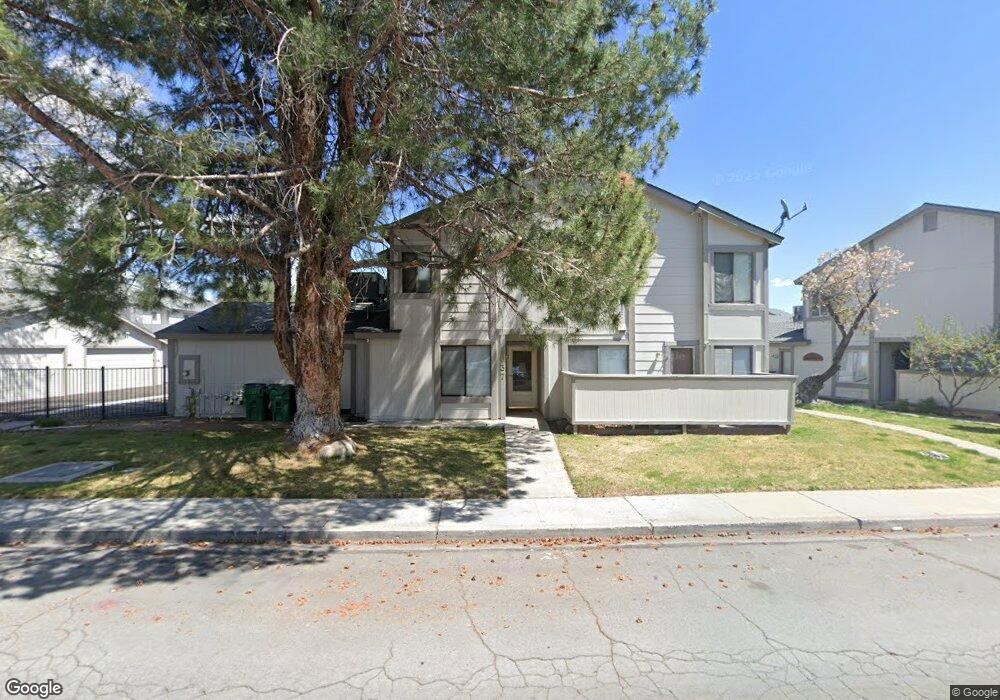
1033 Tyler Way Unit 16 Sparks, NV 89431
North Rock NeighborhoodEstimated Value: $294,484 - $323,000
2
Beds
2
Baths
1,272
Sq Ft
$244/Sq Ft
Est. Value
About This Home
This home is located at 1033 Tyler Way Unit 16, Sparks, NV 89431 and is currently estimated at $310,121, approximately $243 per square foot. 1033 Tyler Way Unit 16 is a home located in Washoe County with nearby schools including Alice Maxwell Elementary School, Sparks Middle School, and Sparks High School.
Ownership History
Date
Name
Owned For
Owner Type
Purchase Details
Closed on
Sep 8, 2005
Sold by
Santillian Jose M
Bought by
Olsen Brown Gay L
Current Estimated Value
Purchase Details
Closed on
Sep 7, 2005
Sold by
Brown Richard Lee
Bought by
Olsen Brown Gay L
Purchase Details
Closed on
Feb 3, 2005
Sold by
Santillan Enedelia
Bought by
Santillan Jose M
Home Financials for this Owner
Home Financials are based on the most recent Mortgage that was taken out on this home.
Original Mortgage
$148,000
Interest Rate
5.87%
Mortgage Type
Unknown
Purchase Details
Closed on
Jan 21, 2005
Sold by
Ruozi Kathryn
Bought by
Santillan Jose M
Home Financials for this Owner
Home Financials are based on the most recent Mortgage that was taken out on this home.
Original Mortgage
$148,000
Interest Rate
5.87%
Mortgage Type
Unknown
Purchase Details
Closed on
Oct 2, 2003
Sold by
Santos Claudia H
Bought by
Ruozi Kathryn
Home Financials for this Owner
Home Financials are based on the most recent Mortgage that was taken out on this home.
Original Mortgage
$105,600
Interest Rate
8.95%
Mortgage Type
Unknown
Create a Home Valuation Report for This Property
The Home Valuation Report is an in-depth analysis detailing your home's value as well as a comparison with similar homes in the area
Home Values in the Area
Average Home Value in this Area
Purchase History
| Date | Buyer | Sale Price | Title Company |
|---|---|---|---|
| Olsen Brown Gay L | $217,500 | Western Title Incorporated | |
| Olsen Brown Gay L | -- | Western Title Incorporated | |
| Santillan Jose M | -- | Western Title Incorporated | |
| Santillan Jose M | $185,000 | Western Title Incorporated | |
| Ruozi Kathryn | $360,800 | First Centennial Title Co |
Source: Public Records
Mortgage History
| Date | Status | Borrower | Loan Amount |
|---|---|---|---|
| Previous Owner | Santillan Jose M | $148,000 | |
| Previous Owner | Ruozi Kathryn | $105,600 | |
| Closed | Santillan Jose M | $37,000 |
Source: Public Records
Tax History Compared to Growth
Tax History
| Year | Tax Paid | Tax Assessment Tax Assessment Total Assessment is a certain percentage of the fair market value that is determined by local assessors to be the total taxable value of land and additions on the property. | Land | Improvement |
|---|---|---|---|---|
| 2025 | $823 | $45,028 | $24,325 | $20,703 |
| 2024 | $823 | $45,720 | $23,800 | $21,921 |
| 2023 | $799 | $42,638 | $22,820 | $19,818 |
| 2022 | $777 | $36,861 | $19,425 | $17,436 |
| 2021 | $755 | $32,087 | $14,280 | $17,807 |
| 2020 | $729 | $32,577 | $14,280 | $18,297 |
| 2019 | $696 | $30,161 | $12,040 | $18,121 |
| 2018 | $661 | $26,089 | $8,050 | $18,039 |
| 2017 | $639 | $27,037 | $8,820 | $18,217 |
| 2016 | $624 | $25,331 | $6,545 | $18,786 |
| 2015 | $623 | $24,452 | $5,040 | $19,412 |
| 2014 | $603 | $19,188 | $3,605 | $15,583 |
| 2013 | -- | $15,752 | $2,730 | $13,022 |
Source: Public Records
Map
Nearby Homes
- 1003 Sbragia Way
- 1705 9th St
- 1124 Sbragia Way
- 1110 Xman Way
- 1121 Greenbrae Dr
- 1160 York Way
- 1365 Prospect Ave
- 1125 Dodson Way
- 1345 Plymouth Way
- 2154 Oppio St
- 1945 4th St Unit 32
- 1945 4th St Unit 33
- 1945 4th St Unit 10
- 1940 4th St Unit 20
- 1940 4th St Unit 51
- 1595 York Way
- 1655 Byrd Dr
- 985 10th St
- 1010 12th St
- 0 N Mccarran Blvd Unit 250052909
- 1031 Tyler Way Unit 15
- 1035 Tyler Way
- 1029 Tyler Way
- 988 Holman Way
- 1044 Holman Way
- 1025 Tyler Way
- 986 Holman Way
- 1023 Tyler Way
- 996 Holman Way Unit 6
- 1021 Tyler Way Unit 22
- 1017 Tyler Way Unit 13
- 1027 Tyler Way
- 1019 Tyler Way Unit 23
- 984 Holman Way Unit 3
- 994 Holman Way
- 1037 Holman Way
- 1015 Tyler Way Unit 12
- 982 Holman Way Unit 2
- 992 Holman Way