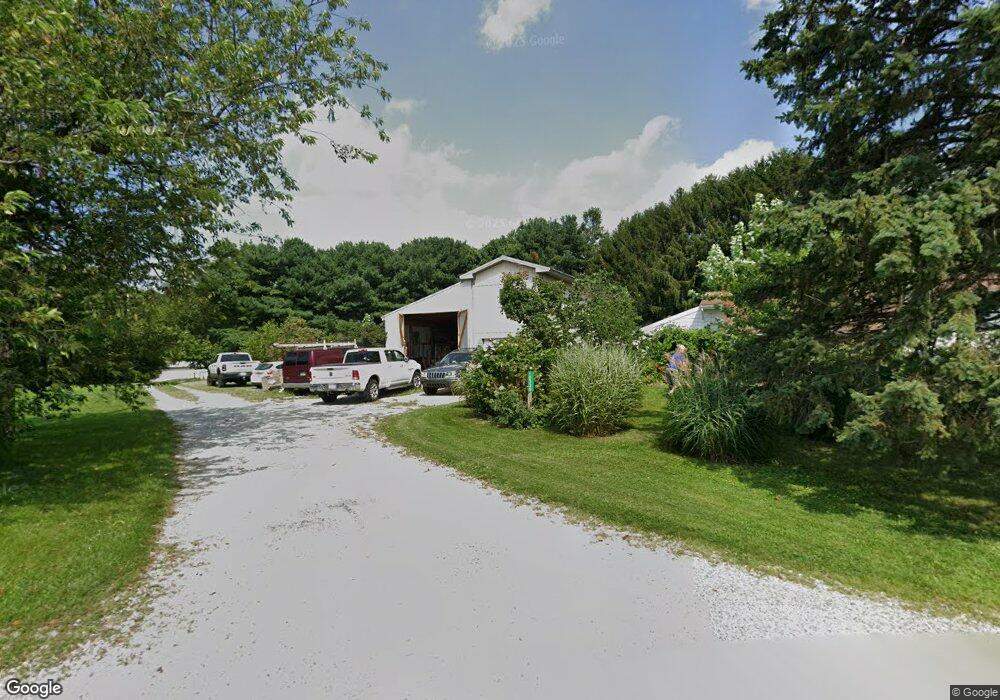
10330 Enfield Rd Felton, PA 17322
Estimated Value: $194,000 - $236,000
2
Beds
1
Bath
840
Sq Ft
$258/Sq Ft
Est. Value
About This Home
This home is located at 10330 Enfield Rd, Felton, PA 17322 and is currently estimated at $217,075, approximately $258 per square foot. 10330 Enfield Rd is a home located in York County with nearby schools including Clearview Elementary School, Red Lion Area Junior High School, and Red Lion Area Senior High School.
Ownership History
Date
Name
Owned For
Owner Type
Purchase Details
Closed on
Apr 9, 2014
Sold by
Bowman Nikki L and Runkle Nikki L
Bought by
Bowman Nikki L and Bowman Steven P
Current Estimated Value
Home Financials for this Owner
Home Financials are based on the most recent Mortgage that was taken out on this home.
Original Mortgage
$76,885
Outstanding Balance
$58,797
Interest Rate
4.5%
Mortgage Type
FHA
Estimated Equity
$158,278
Purchase Details
Closed on
Jan 22, 2007
Sold by
Runkle Carl A and Runkle Nikki L
Bought by
Runkle Nikki L
Purchase Details
Closed on
Aug 29, 2002
Sold by
Reisinger Dale G and Reisinger Jenny M
Bought by
Runkle Carl A and Runkle Nikki L
Home Financials for this Owner
Home Financials are based on the most recent Mortgage that was taken out on this home.
Original Mortgage
$89,100
Interest Rate
6.55%
Mortgage Type
FHA
Create a Home Valuation Report for This Property
The Home Valuation Report is an in-depth analysis detailing your home's value as well as a comparison with similar homes in the area
Home Values in the Area
Average Home Value in this Area
Purchase History
| Date | Buyer | Sale Price | Title Company |
|---|---|---|---|
| Bowman Nikki L | -- | None Available | |
| Runkle Nikki L | -- | None Available | |
| Runkle Carl A | $89,900 | -- |
Source: Public Records
Mortgage History
| Date | Status | Borrower | Loan Amount |
|---|---|---|---|
| Open | Bowman Nikki L | $76,885 | |
| Closed | Runkle Carl A | $89,100 |
Source: Public Records
Tax History Compared to Growth
Tax History
| Year | Tax Paid | Tax Assessment Tax Assessment Total Assessment is a certain percentage of the fair market value that is determined by local assessors to be the total taxable value of land and additions on the property. | Land | Improvement |
|---|---|---|---|---|
| 2025 | $3,037 | $98,730 | $33,620 | $65,110 |
| 2024 | $2,940 | $98,730 | $33,620 | $65,110 |
| 2023 | $2,940 | $98,730 | $33,620 | $65,110 |
| 2022 | $2,940 | $98,730 | $33,620 | $65,110 |
| 2021 | $2,841 | $98,730 | $33,620 | $65,110 |
| 2020 | $2,841 | $98,730 | $33,620 | $65,110 |
| 2019 | $2,831 | $98,730 | $33,620 | $65,110 |
| 2018 | $2,802 | $98,730 | $33,620 | $65,110 |
| 2017 | $2,802 | $98,730 | $33,620 | $65,110 |
| 2016 | $0 | $98,730 | $33,620 | $65,110 |
| 2015 | -- | $98,730 | $33,620 | $65,110 |
| 2014 | -- | $98,730 | $33,620 | $65,110 |
Source: Public Records
Map
Nearby Homes
- 10400 Enfield Rd
- 10640 Enfield Rd
- 10620 Enfield Rd
- 2659 Furnace Rd
- 9981 Douglas Rd
- 9980 Douglas Rd
- 11119 Smith Hollow Rd
- 2758 Furnace Rd
- 2606 Blymire Rd
- 4360 Battlehill Rd
- 1406 Richmond Rd
- 3532 L 6 River Rd
- 798 Goram Rd
- 4877 Battlehill Rd
- 3641 River Rd
- 32 New Bridgeville Rd
- 534 Heffner Rd
- 2019 Snyder Rd
- 2402 Craley Rd
- 2401 Craley Rd
- 10314 Enfield Rd
- 2375 Furnace Rd
- 2359 Furnace Rd
- 10350 Enfield Rd
- 2389 Furnace Rd
- 2393 Furnace Rd
- 2403 Furnace Rd
- 2400 Furnace Rd
- 2413 Furnace Rd
- 2408 Furnace Rd
- 2425 Furnace Rd
- 2419 Furnace Rd
- 2418 Furnace Rd
- 2433 Furnace Rd
- 10460 Enfield Rd
- 2439 Furnace Rd
- 2443 Furnace Rd
- 10485 Enfield Rd
- 2447 Furnace Rd
- 10470 Enfield Rd