L
Seller's Agent in 2018
Louana Salcedo
RE/MAX MASTERS
Estimated Value: $837,000 - $955,000
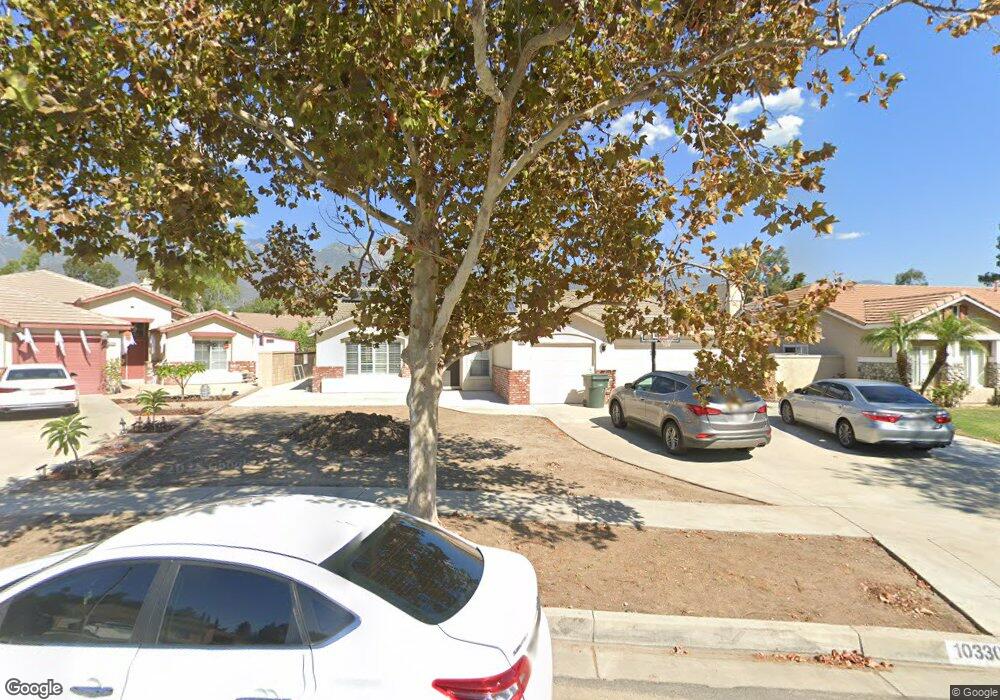
This property WILL SELL IMMEDIATELY! See remarks for submission of offers. This single story home has an EXCELLENT LOCATION! Award winning school location Deer Canyon Elementary, Vineyard Jr. High and LOS OSOS High School. Vaulted ceilings, OVER 11,000 square ft. Lot in a cul-de sac.
Be ready for this home!
| Date | Buyer | Sale Price | Title Company |
|---|---|---|---|
| Holgate Bryce J | $573,000 | Fidelity National Title Comp | |
| Lovelis Scott E | $245,000 | Chicago Title |
| Date | Status | Borrower | Loan Amount |
|---|---|---|---|
| Open | Holgate Bryce J | $453,100 | |
| Previous Owner | Lovelis Scott E | $195,950 | |
| Closed | Lovelis Scott E | $48,950 |
| Date | Event | Price | List to Sale | Price per Sq Ft | Prior Sale |
|---|---|---|---|---|---|
| 02/27/2018 02/27/18 | Sold | $573,000 | -0.3% | $273 / Sq Ft | View Prior Sale |
| 12/07/2017 12/07/17 | Price Changed | $574,999 | +40.2% | $274 / Sq Ft | |
| 11/18/2017 11/18/17 | For Sale | $410,000 | 0.0% | $195 / Sq Ft | |
| 08/01/2016 08/01/16 | Rented | $2,500 | -3.8% | -- | |
| 07/13/2016 07/13/16 | Off Market | $2,600 | -- | -- | |
| 07/06/2016 07/06/16 | For Rent | $2,600 | +8.3% | -- | |
| 05/01/2014 05/01/14 | Rented | $2,400 | 0.0% | -- | |
| 05/01/2014 05/01/14 | For Rent | $2,400 | -- | -- |
| Year | Tax Paid | Tax Assessment Tax Assessment Total Assessment is a certain percentage of the fair market value that is determined by local assessors to be the total taxable value of land and additions on the property. | Land | Improvement |
|---|---|---|---|---|
| 2025 | $7,531 | $683,188 | $162,994 | $520,194 |
| 2024 | $7,531 | $669,792 | $159,798 | $509,994 |
| 2023 | $7,364 | $656,659 | $156,665 | $499,994 |
| 2022 | $7,020 | $614,372 | $153,593 | $460,779 |
| 2021 | $7,018 | $602,325 | $150,581 | $451,744 |
| 2020 | $6,735 | $596,149 | $149,037 | $447,112 |
| 2019 | $6,811 | $584,460 | $146,115 | $438,345 |
| 2018 | $3,833 | $329,036 | $81,109 | $247,927 |
| 2017 | $3,664 | $322,585 | $79,519 | $243,066 |
| 2016 | $3,567 | $316,260 | $77,960 | $238,300 |
| 2015 | $3,545 | $311,510 | $76,789 | $234,721 |
| 2014 | $3,447 | $305,408 | $75,285 | $230,123 |
L
Seller's Agent in 2018
Louana Salcedo
RE/MAX MASTERS

Seller Co-Listing Agent in 2018
Robert Sanchez
eHomes
(909) 557-6890
2 in this area
129 Total Sales
Buyer's Agent in 2018
CHERI VERLINGO
BERKSHIRE HATH HM SVCS CA PROP
(909) 223-3434
11 in this area
55 Total Sales
P
Seller's Agent in 2016
Peggy Petta
REALTY ONE GROUP WEST
(909) 263-0564
2 in this area
20 Total Sales
N
Buyer's Agent in 2016
NELDA QUINTANA
REALTY WORLD DIAMOND
C
Buyer's Agent in 2014
CECILIA BENITES
CENTURY 21 EXPERIENCE