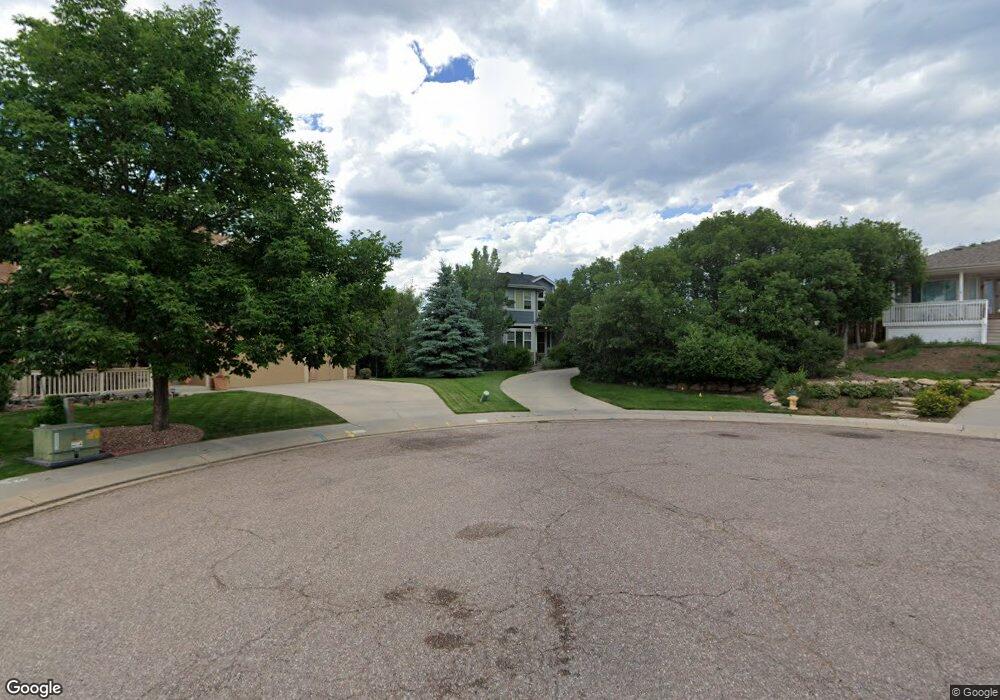
10330 Mill Creek Ct Colorado Springs, CO 80908
Kettle Creek NeighborhoodEstimated Value: $640,865 - $738,000
5
Beds
4
Baths
2,470
Sq Ft
$284/Sq Ft
Est. Value
About This Home
This home is located at 10330 Mill Creek Ct, Colorado Springs, CO 80908 and is currently estimated at $702,216, approximately $284 per square foot. 10330 Mill Creek Ct is a home located in El Paso County with nearby schools including Mountain View Elementary School, Challenger Middle School, and Pine Creek High School.
Ownership History
Date
Name
Owned For
Owner Type
Purchase Details
Closed on
Oct 26, 2010
Sold by
Cameron Kirk M D and Cameron Kelly M
Bought by
Cameron Kirk M and Cameron Kelly M
Current Estimated Value
Home Financials for this Owner
Home Financials are based on the most recent Mortgage that was taken out on this home.
Original Mortgage
$125,630
Interest Rate
4.41%
Mortgage Type
New Conventional
Purchase Details
Closed on
Mar 29, 2000
Sold by
Moore Charles D and Moore Enid O
Bought by
Cameron Kirk M D and Cameron Kelly M
Home Financials for this Owner
Home Financials are based on the most recent Mortgage that was taken out on this home.
Original Mortgage
$212,000
Outstanding Balance
$72,735
Interest Rate
8.25%
Estimated Equity
$629,481
Purchase Details
Closed on
Nov 22, 1995
Sold by
Master Bilt Homes Inc
Bought by
Moore Charles D and Moore Enid O
Home Financials for this Owner
Home Financials are based on the most recent Mortgage that was taken out on this home.
Original Mortgage
$185,230
Interest Rate
7.48%
Create a Home Valuation Report for This Property
The Home Valuation Report is an in-depth analysis detailing your home's value as well as a comparison with similar homes in the area
Home Values in the Area
Average Home Value in this Area
Purchase History
| Date | Buyer | Sale Price | Title Company |
|---|---|---|---|
| Cameron Kirk M | -- | None Available | |
| Cameron Kirk M D | $265,000 | First American | |
| Moore Charles D | $217,918 | Land Title |
Source: Public Records
Mortgage History
| Date | Status | Borrower | Loan Amount |
|---|---|---|---|
| Closed | Cameron Kirk M | $125,630 | |
| Open | Cameron Kirk M D | $212,000 | |
| Previous Owner | Moore Charles D | $185,230 |
Source: Public Records
Tax History Compared to Growth
Tax History
| Year | Tax Paid | Tax Assessment Tax Assessment Total Assessment is a certain percentage of the fair market value that is determined by local assessors to be the total taxable value of land and additions on the property. | Land | Improvement |
|---|---|---|---|---|
| 2025 | $2,444 | $45,360 | -- | -- |
| 2024 | $2,422 | $44,520 | $6,030 | $38,490 |
| 2022 | $2,307 | $34,870 | $6,030 | $28,840 |
| 2021 | $2,563 | $35,870 | $6,200 | $29,670 |
| 2020 | $2,363 | $30,690 | $4,950 | $25,740 |
| 2019 | $2,337 | $30,690 | $4,950 | $25,740 |
| 2018 | $2,195 | $28,320 | $4,540 | $23,780 |
| 2017 | $2,187 | $28,320 | $4,540 | $23,780 |
| 2016 | $2,224 | $28,770 | $4,660 | $24,110 |
| 2015 | $2,220 | $28,770 | $4,660 | $24,110 |
| 2014 | $2,096 | $27,140 | $4,660 | $22,480 |
Source: Public Records
Map
Nearby Homes
- 2232 Arikaree Heights Unit 302
- Tymbre Plan at Victory Ridge - The Residences
- 2232 Arikaree Heights Unit 207
- Michael Plan at Victory Ridge - The Residences
- 2232 Arikaree Heights Unit 208
- 2232 Arikaree Heights Unit 101
- 2232 Arikaree Heights Unit 205
- Brendon Plan at Victory Ridge - Parkside
- Tristyn Plan at Victory Ridge - Parkside
- Nolan Plan at Victory Ridge - The Commons
- Greyson Plan at Victory Ridge - The Commons
- Jolene Plan at Victory Ridge - The Commons
- Landon Plan at Victory Ridge - Parkside
- Henry Plan at Victory Ridge - The Commons
- Willow Plan at Victory Ridge - The Commons
- 9825 Pleasanton Dr
- 10546 Domeykite View
- 2173 Arikaree Heights
- 9765 Pleasanton Dr
- 10634 Eulcase Heights
- 10320 Mill Creek Ct
- 10325 Mill Creek Ct
- 10335 Marble Creek Cir
- 10325 Marble Creek Cir
- 10345 Marble Creek Cir
- 10310 Mill Creek Ct
- 10315 Mill Creek Ct
- 10315 Marble Creek Cir
- 2710 Stone Creek Rd
- 10305 Marble Creek Cir
- 10365 Marble Creek Cir
- 10420 Marble Creek Cir
- 2730 Stone Creek Rd
- 10340 Marble Creek Cir
- 2635 Stone Creek Rd
- 2625 Stone Creek Rd
- 2705 Stone Creek Rd
- 10330 Marble Creek Cir
- 2615 Stone Creek Rd
- 10320 Marble Creek Cir