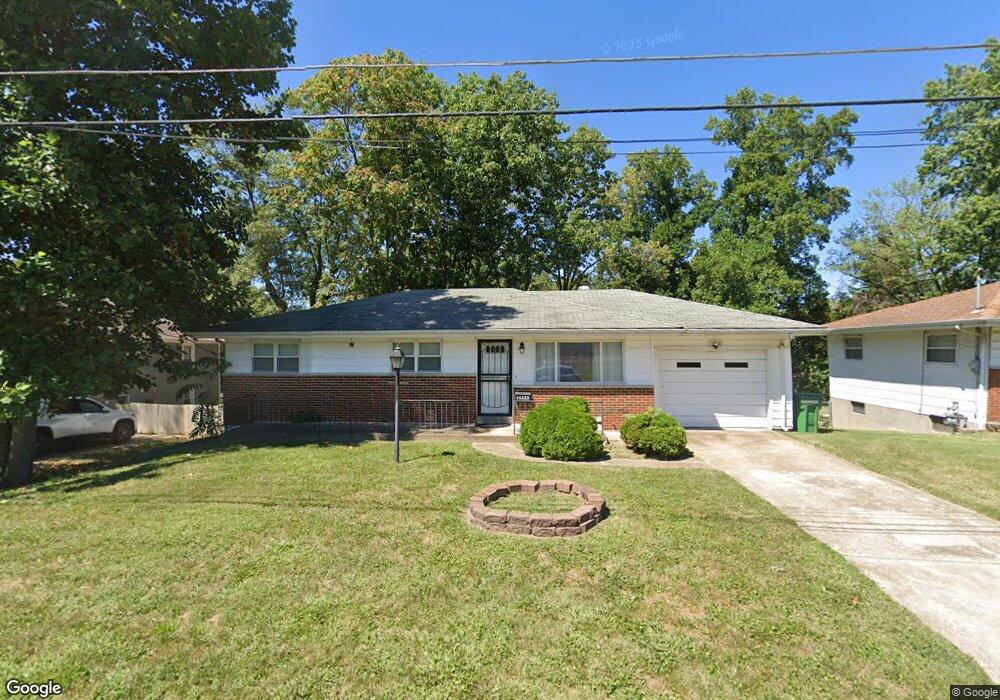
10333 Toelle Ln Saint Louis, MO 63137
Estimated Value: $96,157 - $112,000
4
Beds
2
Baths
874
Sq Ft
$118/Sq Ft
Est. Value
About This Home
This home is located at 10333 Toelle Ln, Saint Louis, MO 63137 and is currently estimated at $103,539, approximately $118 per square foot. 10333 Toelle Ln is a home located in St. Louis County with nearby schools including Riverview Gardens Senior High School and Grace Chapel Lutheran School.
Ownership History
Date
Name
Owned For
Owner Type
Purchase Details
Closed on
Oct 30, 2024
Sold by
Maclin Kimberly R
Bought by
Thomas Cheryl
Current Estimated Value
Home Financials for this Owner
Home Financials are based on the most recent Mortgage that was taken out on this home.
Original Mortgage
$88,369
Outstanding Balance
$87,074
Interest Rate
6.09%
Mortgage Type
FHA
Estimated Equity
$16,465
Purchase Details
Closed on
Sep 29, 2009
Sold by
Newberry Carlos and Newberry Denise
Bought by
Maclin Kimberly R
Home Financials for this Owner
Home Financials are based on the most recent Mortgage that was taken out on this home.
Original Mortgage
$81,965
Interest Rate
5.12%
Mortgage Type
New Conventional
Purchase Details
Closed on
Feb 26, 2003
Sold by
Ursini Beulah M
Bought by
Newberry Carlos and Newberry Denise
Home Financials for this Owner
Home Financials are based on the most recent Mortgage that was taken out on this home.
Original Mortgage
$83,323
Interest Rate
5.86%
Mortgage Type
Unknown
Create a Home Valuation Report for This Property
The Home Valuation Report is an in-depth analysis detailing your home's value as well as a comparison with similar homes in the area
Home Values in the Area
Average Home Value in this Area
Purchase History
| Date | Buyer | Sale Price | Title Company |
|---|---|---|---|
| Thomas Cheryl | -- | None Listed On Document | |
| Maclin Kimberly R | $84,500 | Assured Title Company | |
| Newberry Carlos | $85,900 | -- |
Source: Public Records
Mortgage History
| Date | Status | Borrower | Loan Amount |
|---|---|---|---|
| Open | Thomas Cheryl | $88,369 | |
| Previous Owner | Maclin Kimberly R | $81,965 | |
| Previous Owner | Newberry Carlos | $83,323 |
Source: Public Records
Tax History Compared to Growth
Tax History
| Year | Tax Paid | Tax Assessment Tax Assessment Total Assessment is a certain percentage of the fair market value that is determined by local assessors to be the total taxable value of land and additions on the property. | Land | Improvement |
|---|---|---|---|---|
| 2025 | $1,801 | $17,540 | $2,700 | $14,840 |
| 2024 | $1,801 | $15,620 | $2,700 | $12,920 |
| 2023 | $1,779 | $15,620 | $2,700 | $12,920 |
| 2022 | $1,714 | $12,040 | $3,000 | $9,040 |
| 2021 | $1,699 | $12,040 | $3,000 | $9,040 |
| 2020 | $1,285 | $9,880 | $2,740 | $7,140 |
| 2019 | $1,248 | $9,880 | $2,740 | $7,140 |
| 2018 | $1,198 | $8,870 | $1,290 | $7,580 |
| 2017 | $1,158 | $8,870 | $1,290 | $7,580 |
| 2016 | $1,399 | $10,620 | $1,670 | $8,950 |
| 2015 | $1,275 | $10,620 | $1,670 | $8,950 |
| 2014 | $1,161 | $9,690 | $2,450 | $7,240 |
Source: Public Records
Map
Nearby Homes
- 936 Amaral Cir
- 10501 Lilac Ave
- 10201 Mccartney Ln
- 521 Alcove Ave
- 10477 Toelle Ln
- 10066 Dorothy Ave
- 10043 Lilac Ave
- 10030 Mccartney Ln
- 10071 Diamond Dr
- 10017 Mccartney Ln
- 10336 Durness Dr
- 10130 Newbold Dr
- 1122 Roxton Dr
- 10370 Renfrew Dr
- 700 Chambers Rd
- 448 Lancashire Rd
- 10331 Renfrew Dr
- 10327 Renfrew Dr Unit 2
- 1131 Roxton Dr
- 437 Lancashire Rd