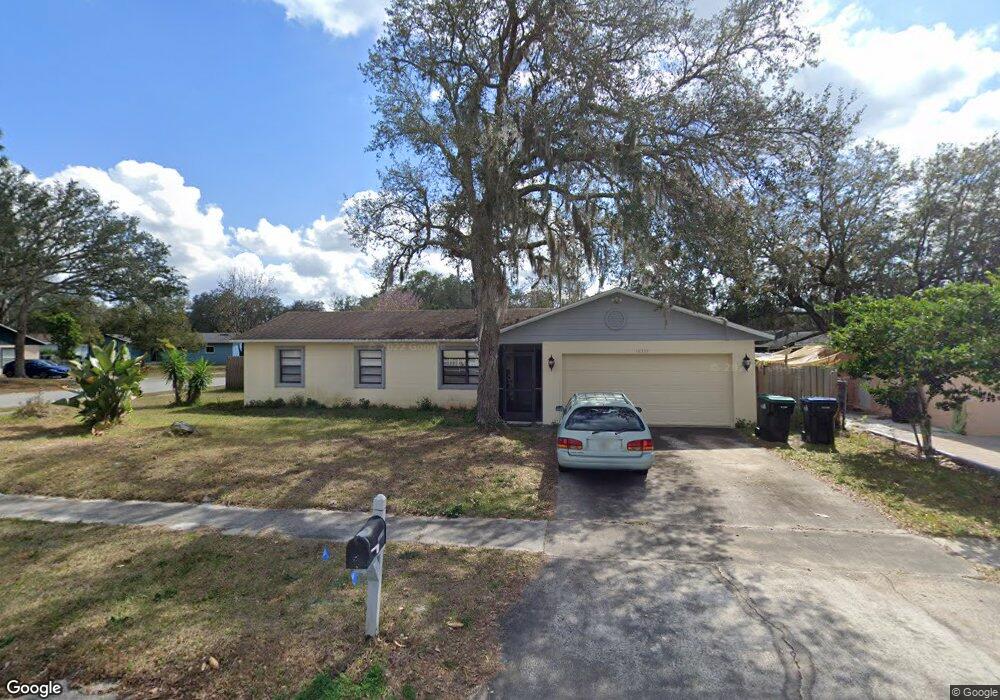
10334 Belgrove Place Unit 6 Orlando, FL 32817
Estimated Value: $334,000 - $367,000
4
Beds
2
Baths
1,221
Sq Ft
$283/Sq Ft
Est. Value
About This Home
This home is located at 10334 Belgrove Place Unit 6, Orlando, FL 32817 and is currently estimated at $346,143, approximately $283 per square foot. 10334 Belgrove Place Unit 6 is a home located in Orange County with nearby schools including Riverdale Elementary School, Union Park Middle School, and University High School.
Ownership History
Date
Name
Owned For
Owner Type
Purchase Details
Closed on
Jul 10, 2017
Sold by
Wolfe Alan R and Wolfe Susan E
Bought by
Lara Shirley
Current Estimated Value
Home Financials for this Owner
Home Financials are based on the most recent Mortgage that was taken out on this home.
Original Mortgage
$181,649
Outstanding Balance
$152,390
Interest Rate
4.25%
Mortgage Type
FHA
Estimated Equity
$193,753
Purchase Details
Closed on
Apr 28, 2006
Sold by
Klein Jerry and Klein Jenny L
Bought by
Wolfe Alan R and Wolfe Susan E
Home Financials for this Owner
Home Financials are based on the most recent Mortgage that was taken out on this home.
Original Mortgage
$135,000
Interest Rate
6.28%
Mortgage Type
Fannie Mae Freddie Mac
Purchase Details
Closed on
Jul 16, 2002
Sold by
Urai M Creasy I
Bought by
Hines Urai M
Create a Home Valuation Report for This Property
The Home Valuation Report is an in-depth analysis detailing your home's value as well as a comparison with similar homes in the area
Home Values in the Area
Average Home Value in this Area
Purchase History
| Date | Buyer | Sale Price | Title Company |
|---|---|---|---|
| Lara Shirley | $185,000 | First Americn Title Insuranc | |
| Wolfe Alan R | $219,000 | Chelsea Title Company | |
| Hines Urai M | -- | -- |
Source: Public Records
Mortgage History
| Date | Status | Borrower | Loan Amount |
|---|---|---|---|
| Open | Lara Shirley | $181,649 | |
| Previous Owner | Wolfe Alan R | $135,000 |
Source: Public Records
Tax History Compared to Growth
Tax History
| Year | Tax Paid | Tax Assessment Tax Assessment Total Assessment is a certain percentage of the fair market value that is determined by local assessors to be the total taxable value of land and additions on the property. | Land | Improvement |
|---|---|---|---|---|
| 2025 | $4,507 | $261,144 | -- | -- |
| 2024 | $3,867 | $261,144 | -- | -- |
| 2023 | $3,867 | $246,194 | $70,000 | $176,194 |
| 2022 | $3,483 | $217,919 | $70,000 | $147,919 |
| 2021 | $3,109 | $178,365 | $60,000 | $118,365 |
| 2020 | $2,795 | $164,651 | $55,000 | $109,651 |
| 2019 | $1,900 | $139,459 | $0 | $0 |
| 2018 | $1,873 | $136,859 | $40,000 | $96,859 |
| 2017 | $2,138 | $124,402 | $35,000 | $89,402 |
| 2016 | $1,867 | $97,797 | $26,000 | $71,797 |
| 2015 | $1,790 | $93,228 | $25,000 | $68,228 |
| 2014 | $1,680 | $81,856 | $25,000 | $56,856 |
Source: Public Records
Map
Nearby Homes
- 10290 Buck Rd
- 2751 Titus Ct
- 10336 Buck Rd
- 2927 Ahern Dr
- 2900 Cleburne Rd
- 10343 Riva Ridge Trail
- 2908 Cleburne Rd
- 10020 Arbor Ridge Trail
- 2904 Cleburne Rd
- 2850 Cleburne Rd
- 2917 Cleburne Rd
- 2726 N Dean Rd
- 3230 Buck Hill Place
- 9915 Kona Isle Ct
- 3309 Paisley Cir
- Wilshire Plan at Harrell Oaks
- Willow Plan at Harrell Oaks
- Lotus Plan at Harrell Oaks
- Newcastle Plan at Harrell Oaks
- Miles Plan at Harrell Oaks
- 10334 Belgrove Place
- 10328 Belgrove Place
- 10333 Arbor Ridge Trail
- 10325 Arbor Ridge Trail
- 2817 Arcata Ln
- 10322 Belgrove Place
- 2849 Arcata Ln
- 2850 Arcata Ln
- 10335 Belgrove Place
- 2825 Arcata Ln
- 10329 Belgrove Place
- 10319 Arbor Ridge Trail
- 10341 Arbor Ridge Trail
- 2833 Arcata Ln
- 10323 Belgrove Place
- 10316 Belgrove Place
- 10313 Arbor Ridge Trail
- 10347 Arbor Ridge Trail
- 10347 Arbor Ridge Trail Unit 4
- 2842 Arcata Ln Unit 6