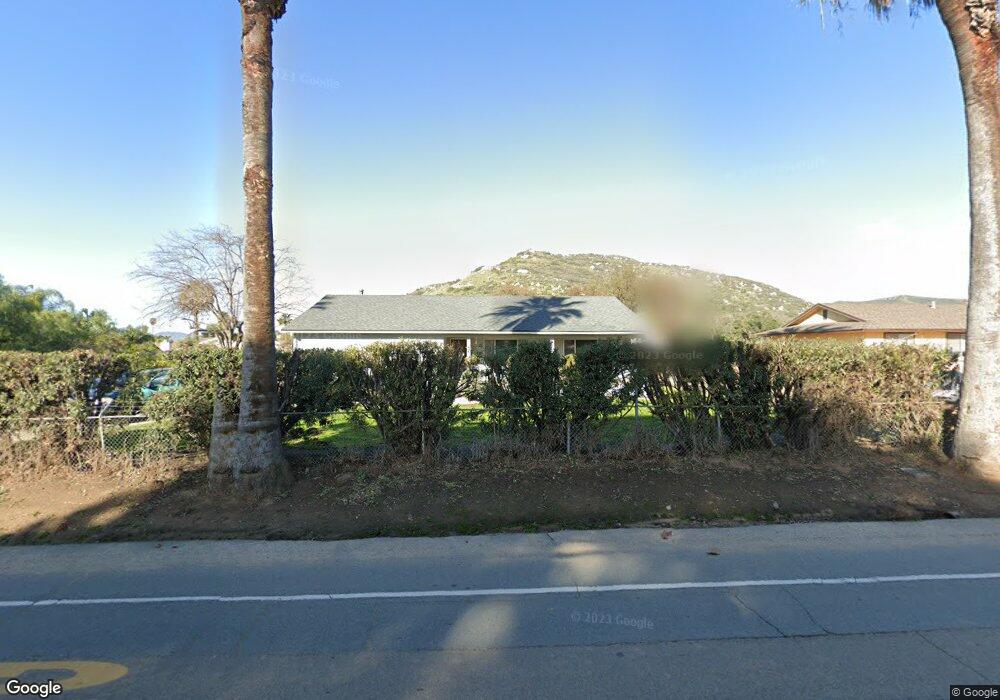
10336 Palm Row Dr Lakeside, CA 92040
Estimated Value: $823,000 - $838,000
2
Beds
2
Baths
1,632
Sq Ft
$508/Sq Ft
Est. Value
About This Home
This home is located at 10336 Palm Row Dr, Lakeside, CA 92040 and is currently estimated at $829,132, approximately $508 per square foot. 10336 Palm Row Dr is a home located in San Diego County with nearby schools including Lakeside Farms Elementary School, Lakeside Middle School, and El Capitan High School.
Ownership History
Date
Name
Owned For
Owner Type
Purchase Details
Closed on
Jun 12, 2021
Sold by
Bradley John S and John S Bradley Family Trust
Bought by
Bradley John S and John S Bradley Family Trust
Current Estimated Value
Home Financials for this Owner
Home Financials are based on the most recent Mortgage that was taken out on this home.
Original Mortgage
$1,029,000
Outstanding Balance
$1,015,251
Interest Rate
2.9%
Mortgage Type
Reverse Mortgage Home Equity Conversion Mortgage
Estimated Equity
-$186,119
Purchase Details
Closed on
Mar 21, 1997
Sold by
Bradley John S
Bought by
Bradley John S
Purchase Details
Closed on
Feb 26, 1997
Sold by
Bradley John S
Bought by
Bradley John S
Purchase Details
Closed on
Dec 11, 1996
Sold by
Bradley John S
Bought by
Bradley John S
Purchase Details
Closed on
Aug 17, 1990
Create a Home Valuation Report for This Property
The Home Valuation Report is an in-depth analysis detailing your home's value as well as a comparison with similar homes in the area
Home Values in the Area
Average Home Value in this Area
Purchase History
| Date | Buyer | Sale Price | Title Company |
|---|---|---|---|
| Bradley John S | -- | Fnc Title Of California | |
| Bradley John S | -- | -- | |
| Bradley John S | -- | -- | |
| Bradley John S | -- | -- | |
| -- | $219,500 | -- |
Source: Public Records
Mortgage History
| Date | Status | Borrower | Loan Amount |
|---|---|---|---|
| Open | Bradley John S | $1,029,000 |
Source: Public Records
Tax History Compared to Growth
Tax History
| Year | Tax Paid | Tax Assessment Tax Assessment Total Assessment is a certain percentage of the fair market value that is determined by local assessors to be the total taxable value of land and additions on the property. | Land | Improvement |
|---|---|---|---|---|
| 2025 | $4,500 | $378,744 | $216,427 | $162,317 |
| 2024 | $4,500 | $371,319 | $212,184 | $159,135 |
| 2023 | $4,340 | $364,039 | $208,024 | $156,015 |
| 2022 | $4,271 | $356,902 | $203,946 | $152,956 |
| 2021 | $4,205 | $349,905 | $199,948 | $149,957 |
| 2020 | $4,155 | $346,318 | $197,898 | $148,420 |
| 2019 | $4,078 | $339,528 | $194,018 | $145,510 |
| 2018 | $4,028 | $332,871 | $190,214 | $142,657 |
| 2017 | $822 | $326,345 | $186,485 | $139,860 |
| 2016 | $3,858 | $319,947 | $182,829 | $137,118 |
| 2015 | $3,837 | $315,142 | $180,083 | $135,059 |
| 2014 | $3,644 | $308,970 | $176,556 | $132,414 |
Source: Public Records
Map
Nearby Homes
- 10473 Towns Terrace
- 11851 Riverside Dr Unit 206
- 11436 El Nopal
- 11457 El Nopal
- 11949 Riverside Dr Unit 28
- 11949 Riverside Dr Unit 23
- 11949 Riverside Dr Unit 7
- 11949 Riverside Dr Unit 176
- 10703 Oak Creek Dr
- 0 Riverford Rd Unit 3
- 11320 El Nopal Unit 5619
- 12049 Coping Place
- 11034 Brookfield Ct
- 10103 Riverhill Ln
- 10906 Serena Ln
- 11493 Eucalyptus Hills Dr
- 11010 El Nopal
- 11529 Woodside Ave
- 10410 Bosque Dr
- 11977 Raceway Ln
- 10344 Palm Row Dr
- 10434 Plaza Paseo Dr
- 10428 Plaza Paseo Dr
- 10422 Plaza Paseo Dr
- 10347 Palm Row Dr
- 10416 Plaza Paseo Dr
- 10315 Palm Row Dr
- 10410 Plaza Paseo Dr
- 10355 Paseo Palmas Dr
- 10311 Palm Row Dr
- 10354 Paseo Palmas Dr
- 10404 Plaza Paseo Dr
- 10348 Palm Row Dr
- 10367 Palm Row Dr
- 10349 Paseo Palmas Dr
- 10341 Plaza Paseo Dr
- 10348 Paseo Palmas Dr
- 10345 Palm Row Dr
- 10350 Plaza Paseo Dr
- 10343 Paseo Palmas Dr