10336 Paw Paw Lake Dr Mattawan, MI 49071
Estimated Value: $996,000 - $1,044,122
--
Bed
--
Bath
3,730
Sq Ft
$273/Sq Ft
Est. Value
About This Home
This home is located at 10336 Paw Paw Lake Dr, Mattawan, MI 49071 and is currently estimated at $1,020,061, approximately $273 per square foot. 10336 Paw Paw Lake Dr is a home located in Kalamazoo County with nearby schools including Mattawan Early Elementary School, Mattawan Early Childhood Education Center, and Mattawan Later Elementary School.
Ownership History
Date
Name
Owned For
Owner Type
Purchase Details
Closed on
Mar 9, 2021
Sold by
Sirkin Lorry and Gamm Audrey
Bought by
Sirkin Sean and Ochoa Elisa
Current Estimated Value
Home Financials for this Owner
Home Financials are based on the most recent Mortgage that was taken out on this home.
Original Mortgage
$548,250
Outstanding Balance
$491,467
Interest Rate
2.7%
Mortgage Type
New Conventional
Estimated Equity
$528,594
Purchase Details
Closed on
Sep 3, 2020
Sold by
Sirkin Sean and Ochoa Elisa
Bought by
Sirkin Sean and Ochoa Elisa
Purchase Details
Closed on
Jul 1, 2020
Sold by
Libby Glen D and Libby Carolyn
Bought by
Sirkin Sean and Ochoa Elisa
Purchase Details
Closed on
Nov 11, 2015
Sold by
Libby Glen D and Libby Carolyn
Bought by
Glenn D Libby & Carolyn Libby Trust
Purchase Details
Closed on
Jun 27, 2012
Sold by
Libby Glen and Libby Carolyn
Bought by
Libby Glen and Libby Carolyn
Create a Home Valuation Report for This Property
The Home Valuation Report is an in-depth analysis detailing your home's value as well as a comparison with similar homes in the area
Home Values in the Area
Average Home Value in this Area
Purchase History
| Date | Buyer | Sale Price | Title Company |
|---|---|---|---|
| Sirkin Sean | -- | None Available | |
| Sirkin Sean | -- | None Available | |
| Sirkin Sean | $981,897 | None Available | |
| Glenn D Libby & Carolyn Libby Trust | -- | Attorney | |
| Libby Glen | -- | None Available |
Source: Public Records
Mortgage History
| Date | Status | Borrower | Loan Amount |
|---|---|---|---|
| Open | Sirkin Sean | $548,250 |
Source: Public Records
Tax History Compared to Growth
Tax History
| Year | Tax Paid | Tax Assessment Tax Assessment Total Assessment is a certain percentage of the fair market value that is determined by local assessors to be the total taxable value of land and additions on the property. | Land | Improvement |
|---|---|---|---|---|
| 2025 | $14,208 | $546,400 | $0 | $0 |
| 2024 | $4,577 | $525,300 | $0 | $0 |
| 2023 | $4,363 | $491,400 | $0 | $0 |
| 2022 | $12,896 | $387,000 | $0 | $0 |
| 2021 | $12,573 | $376,100 | $0 | $0 |
| 2020 | $7,432 | $491,400 | $0 | $0 |
| 2019 | $6,794 | $406,500 | $0 | $0 |
| 2018 | $4,656 | $406,500 | $0 | $0 |
| 2017 | -- | $399,600 | $0 | $0 |
| 2016 | -- | $399,100 | $0 | $0 |
| 2015 | -- | $321,500 | $144,000 | $177,500 |
| 2014 | -- | $321,500 | $0 | $0 |
Source: Public Records
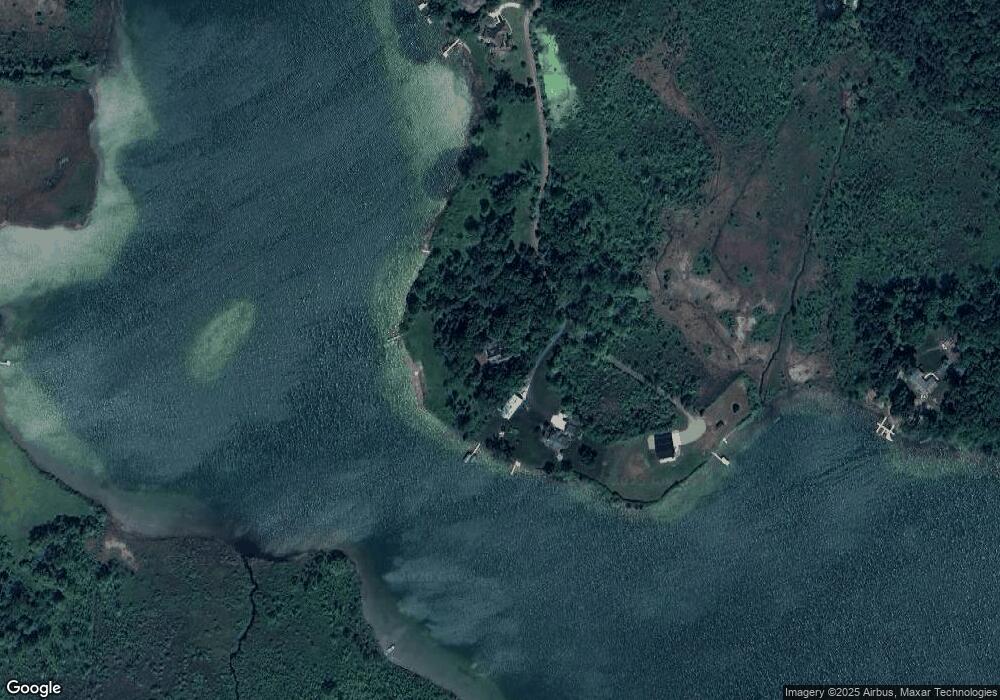
Map
Nearby Homes
- 10144 Paw Lake Dr
- 10096 W S Ave W
- 69434 22nd St
- 9980 S 2nd St
- 9669 W S Ave
- 9827 W Rs Ave
- 8975 W S Ave
- 74066 Ridgeway
- 74032 Ridgeway
- 74016 Ridgeway
- 9582 W R Ave
- 9622 W R Ave
- 8833 W Rs Ave
- 23116 Cr 354
- 58642 Blue Stem Cir
- 23920 64th Ave
- Tract #3 S van Kal & W V Ave
- 8257 S 2nd St
- Tract #4 S van Kal & W V Ave
- Tract #6 S van Kal & W V Ave
- 10336 Paw Paw Lake Dr
- 10352 Paw Paw Lake Dr
- 10352 Paw Paw Lake Dr
- 10308 Paw Paw Lake Dr
- 10308 Paw Paw Lake Dr
- 10314 Paw Paw Lake Dr
- 10417 S Ave
- 10423 S Ave
- 10431 S Ave
- 10500 Paw Paw Lake Dr
- 10500 Paw Paw Lake Dr
- 10433 S Ave
- 10437 S Ave W
- 10437 S Ave
- 10640 Paw Paw Lake Dr
- 10640 Paw Paw Lake Dr
- 10441 S Ave
- 10441 S Ave
- 10441 S Ave
- 10441 S Ave