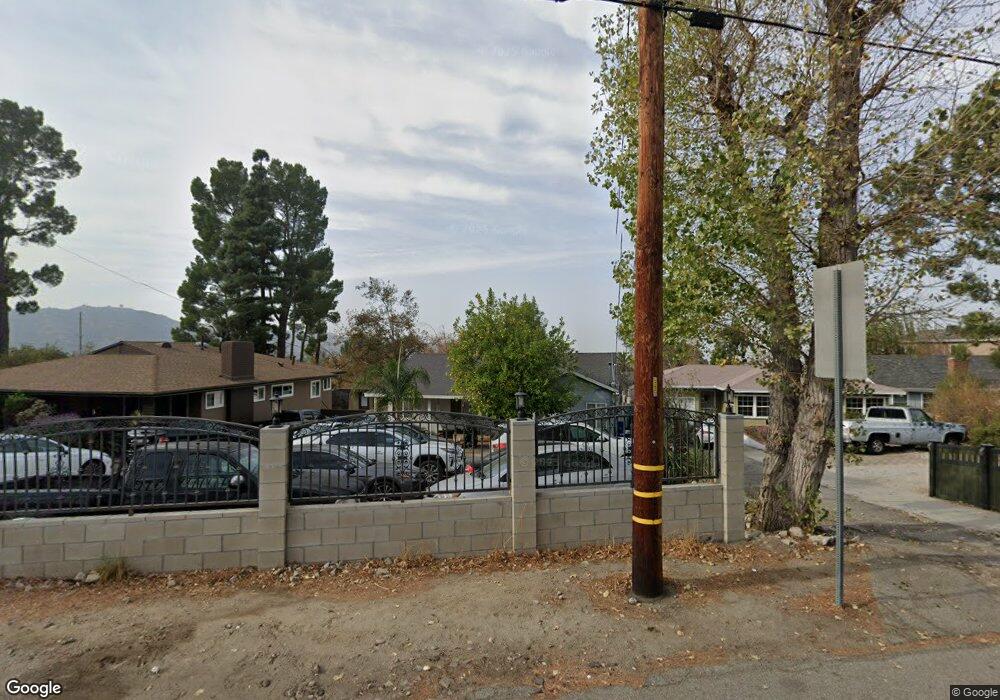
10339 Tujunga Canyon Blvd Tujunga, CA 91042
Estimated Value: $843,000 - $949,000
2
Beds
2
Baths
1,494
Sq Ft
$588/Sq Ft
Est. Value
About This Home
This home is located at 10339 Tujunga Canyon Blvd, Tujunga, CA 91042 and is currently estimated at $879,000, approximately $588 per square foot. 10339 Tujunga Canyon Blvd is a home located in Los Angeles County with nearby schools including Mt. Gleason Middle School, Verdugo Hills Senior High School, and Plainview Academic Charter Academy.
Ownership History
Date
Name
Owned For
Owner Type
Purchase Details
Closed on
Jan 25, 2002
Sold by
Campoverde Sara and Hernandez Pauline I
Bought by
Campoverde Sara
Current Estimated Value
Home Financials for this Owner
Home Financials are based on the most recent Mortgage that was taken out on this home.
Original Mortgage
$140,250
Outstanding Balance
$68,705
Interest Rate
9.9%
Estimated Equity
$810,295
Purchase Details
Closed on
Sep 17, 1997
Sold by
Va
Bought by
Campoverde Sara
Home Financials for this Owner
Home Financials are based on the most recent Mortgage that was taken out on this home.
Original Mortgage
$113,046
Interest Rate
7.44%
Purchase Details
Closed on
Jul 24, 1996
Sold by
Countrywide Funding Corp
Bought by
Va
Purchase Details
Closed on
Jun 26, 1996
Sold by
Choi Anthony
Bought by
Countrywide Funding Corp
Create a Home Valuation Report for This Property
The Home Valuation Report is an in-depth analysis detailing your home's value as well as a comparison with similar homes in the area
Home Values in the Area
Average Home Value in this Area
Purchase History
| Date | Buyer | Sale Price | Title Company |
|---|---|---|---|
| Campoverde Sara | -- | California Counties Title Co | |
| Campoverde Sara | $115,000 | Old Republic Title | |
| Va | -- | -- | |
| Countrywide Funding Corp | $123,090 | Continental Lawyers Title Co |
Source: Public Records
Mortgage History
| Date | Status | Borrower | Loan Amount |
|---|---|---|---|
| Open | Campoverde Sara | $140,250 | |
| Closed | Campoverde Sara | $113,046 |
Source: Public Records
Tax History
| Year | Tax Paid | Tax Assessment Tax Assessment Total Assessment is a certain percentage of the fair market value that is determined by local assessors to be the total taxable value of land and additions on the property. | Land | Improvement |
|---|---|---|---|---|
| 2025 | $7,085 | $272,605 | $146,187 | $126,418 |
| 2024 | $7,085 | $267,261 | $143,321 | $123,940 |
| 2023 | $7,021 | $262,021 | $140,511 | $121,510 |
| 2022 | $6,732 | $247,042 | $137,756 | $109,286 |
| 2021 | $6,688 | $242,199 | $135,055 | $107,144 |
| 2019 | $6,321 | $214,429 | $131,050 | $83,379 |
| 2018 | $6,202 | $210,226 | $128,481 | $81,745 |
| 2016 | $2,587 | $202,065 | $123,493 | $78,572 |
| 2015 | $2,552 | $199,031 | $121,639 | $77,392 |
| 2014 | $2,571 | $195,133 | $119,257 | $75,876 |
Source: Public Records
Map
Nearby Homes
- 10451 Tujunga Canyon Blvd
- 10448 Mountair Ave
- 7225 Apperson St Unit 105
- 10404 Mcclemont Ave
- 10274 Tujunga Canyon Blvd Unit 4
- 10563 Las Lunitas Ave
- 10510 Helendale Ave
- 10139 Hillhaven Ave
- 10626 Mountair Ave
- 7114 Wyngate St
- 10418 Samoa Ave
- 10260 Plainview Ave Unit 12
- 10600 Helen Ave
- 10069 Mountair Ave
- 10214 Samoa Ave Unit 25
- 7539 Valaho Dr
- 10554 Plainview Ave
- 7049 Sunnycrest Trail
- 10743 Mountair Ave
- 10710 Helendale Ave
- 10345 Tujunga Canyon Blvd
- 10337 Tujunga Canyon Blvd
- 10357 Tujunga Canyon Blvd
- 10361 Tujunga Canyon Blvd
- 10365 Tujunga Canyon Blvd
- 10354 Tujunga Canyon Blvd
- 10369 Tujunga Canyon Blvd
- 10371 Tujunga Canyon Blvd
- 10360 Tujunga Canyon Blvd
- 10342 Mountair Ave
- 10348 Mountair Ave
- 10370 Tujunga Canyon Blvd
- 10334 Mountair Ave
- 10330 Mountair Ave
- 10352 Mountair Ave
- 10340 Las Lunitas Ave
- 10403 Tujunga Canyon Blvd
- 10350 Las Lunitas Ave
- 10326 Mountair Ave
- 10404 Tujunga Canyon Blvd
Your Personal Tour Guide
Ask me questions while you tour the home.