Estimated Value: $594,377 - $710,000
4
Beds
4
Baths
3,357
Sq Ft
$197/Sq Ft
Est. Value
About This Home
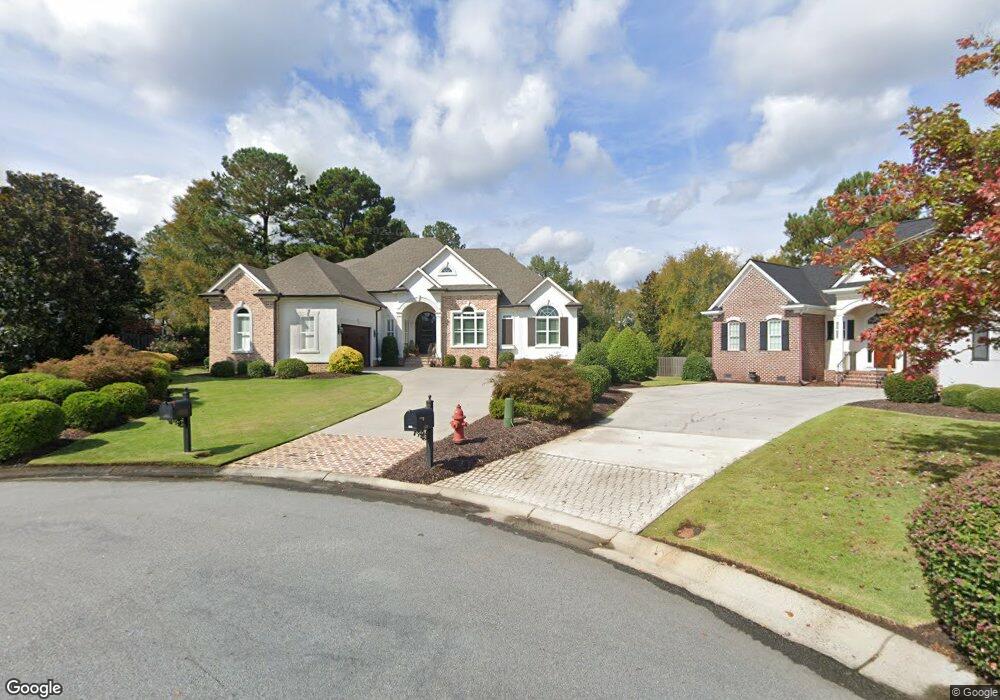
This home is located at 1034 Emerald Place, Evans, GA 30809 and is currently estimated at $661,844, approximately $197 per square foot. 1034 Emerald Place is a home located in Columbia County with nearby schools including Northmore Elementary School, River Ridge Elementary School, and Laurel Ridge Elementary School.
Ownership History
Date
Name
Owned For
Owner Type
Purchase Details
Closed on
Mar 4, 2011
Sold by
Takent Timothy N
Bought by
Stancil Bruce J
Current Estimated Value
Purchase Details
Closed on
Dec 15, 2009
Sold by
Ward Marc E
Bought by
Tallent Timothy
Purchase Details
Closed on
Feb 13, 2006
Sold by
Vintson Const Co Inc
Bought by
Ward Marc E
Home Financials for this Owner
Home Financials are based on the most recent Mortgage that was taken out on this home.
Original Mortgage
$459,000
Interest Rate
5.88%
Mortgage Type
New Conventional
Purchase Details
Closed on
Oct 19, 2004
Sold by
A B & W Properties Llc
Bought by
Vintson Construction Co Inc
Home Financials for this Owner
Home Financials are based on the most recent Mortgage that was taken out on this home.
Original Mortgage
$376,000
Interest Rate
5.73%
Mortgage Type
Unknown
Create a Home Valuation Report for This Property
The Home Valuation Report is an in-depth analysis detailing your home's value as well as a comparison with similar homes in the area
Home Values in the Area
Average Home Value in this Area
Purchase History
| Date | Buyer | Sale Price | Title Company |
|---|---|---|---|
| Stancil Bruce J | $359,000 | -- | |
| Stancil Bruce J | $359,000 | -- | |
| Tallent Timothy | $430,000 | -- | |
| Ward Marc E | $459,000 | -- | |
| Vintson Construction Co Inc | $53,000 | -- |
Source: Public Records
Mortgage History
| Date | Status | Borrower | Loan Amount |
|---|---|---|---|
| Previous Owner | Ward Marc E | $459,000 | |
| Previous Owner | Vintson Construction Co Inc | $376,000 |
Source: Public Records
Tax History Compared to Growth
Tax History
| Year | Tax Paid | Tax Assessment Tax Assessment Total Assessment is a certain percentage of the fair market value that is determined by local assessors to be the total taxable value of land and additions on the property. | Land | Improvement |
|---|---|---|---|---|
| 2025 | $1,736 | $230,248 | $37,074 | $193,174 |
| 2024 | $1,829 | $234,260 | $36,354 | $197,906 |
| 2023 | $1,829 | $198,759 | $35,364 | $163,395 |
| 2022 | $1,785 | $208,955 | $35,004 | $173,951 |
| 2021 | $1,658 | $184,590 | $28,344 | $156,246 |
| 2020 | $1,692 | $180,880 | $26,544 | $154,336 |
| 2019 | $1,541 | $164,922 | $25,194 | $139,728 |
| 2018 | $1,538 | $163,003 | $28,884 | $134,119 |
| 2017 | $1,502 | $157,586 | $24,564 | $133,022 |
| 2016 | $1,394 | $163,338 | $24,540 | $138,798 |
| 2015 | $1,314 | $154,092 | $23,100 | $130,992 |
| 2014 | $4,156 | $154,633 | $23,100 | $131,533 |
Source: Public Records
Map
Nearby Homes
- 1062 Emerald Place
- 1013 Emerald Place
- 4305 Southern Pines Dr
- 612 Emerald Crossing
- 4172 Tindall Dr
- 839 Prairie Ln
- 701 Fosters Ct
- 936 Deercrest Cir
- 536 Laniers Way
- 628 Emerald Crossing
- 4277 Deerwood Ln
- 644 Emerald Crossing
- 846 Willow Lake
- 3113 Sunset Maple Trail
- 516 McKinnes Park
- 4213 Blue Heron Ln
- 876 Willow Lake
- 735 Michaels Creek
- 303 N Sandhills Ln
- 889 Hunting Horn Way E
- 1036 Emerald Place
- 1032 Emerald Place
- 1030 Emerald Place
- 1038 Emerald Place
- 1028 Emerald Place
- 1040 Emerald Place
- 1035 Emerald Place
- 1026 Emerald Place
- 1042 Emerald Place
- 1023 Emerald Place
- 1024 Emerald Place
- 1044 Emerald Place
- 1049 Emerald Place
- 1021 Emerald Place
- 1022 Emerald Place
- 1046 Emerald Place
- 1057 Emerald Place
- 421 Long Needle Cir
- 1019 Emerald Place
- 419 Long Needle Cir