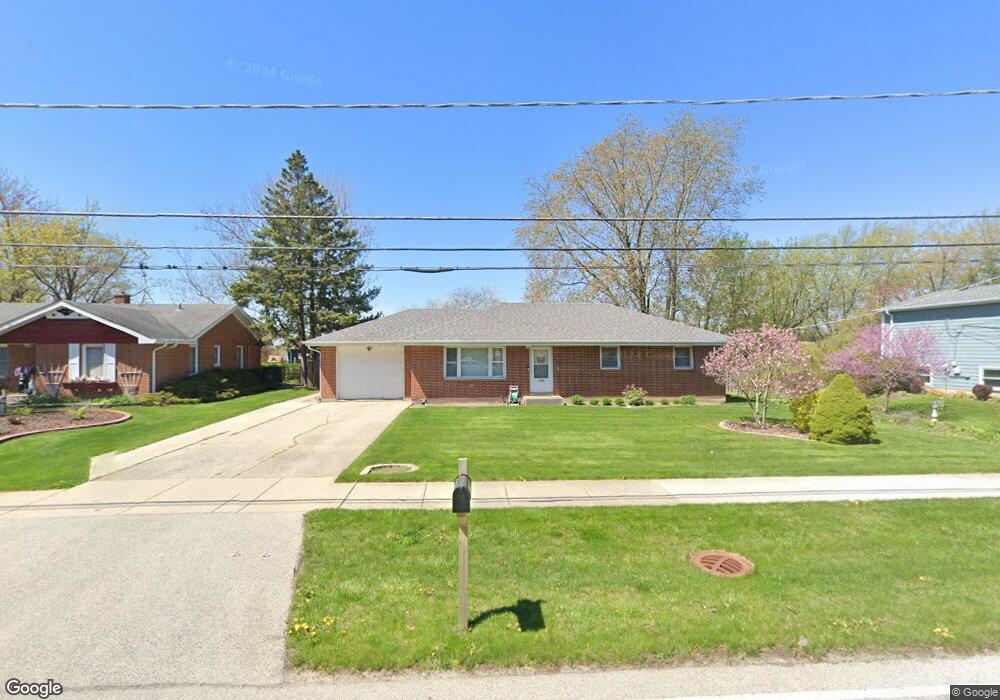
1034 Magnolia Ave Gurnee, IL 60031
Estimated Value: $275,888 - $305,000
--
Bed
2
Baths
1,288
Sq Ft
$225/Sq Ft
Est. Value
About This Home
This home is located at 1034 Magnolia Ave, Gurnee, IL 60031 and is currently estimated at $289,972, approximately $225 per square foot. 1034 Magnolia Ave is a home located in Lake County with nearby schools including Spaulding Elementary School, Viking Middle School, and Warren Township High School.
Ownership History
Date
Name
Owned For
Owner Type
Purchase Details
Closed on
Jul 19, 2002
Sold by
Stoffel Brian R and Stoffel Victoria Rachel
Bought by
Hart Michael R and Hart Deborah J
Current Estimated Value
Home Financials for this Owner
Home Financials are based on the most recent Mortgage that was taken out on this home.
Original Mortgage
$144,000
Outstanding Balance
$60,741
Interest Rate
6.64%
Estimated Equity
$229,231
Purchase Details
Closed on
Apr 26, 2002
Sold by
Stoffel Lillian
Bought by
Stoffel Brian R and Stoffel Victoria Rachel
Purchase Details
Closed on
May 27, 1999
Sold by
Coviello Robert J and Coviello Terry
Bought by
Stoffel Brian R and Stoffel Victoria Rachel
Home Financials for this Owner
Home Financials are based on the most recent Mortgage that was taken out on this home.
Original Mortgage
$143,968
Interest Rate
6.94%
Mortgage Type
FHA
Create a Home Valuation Report for This Property
The Home Valuation Report is an in-depth analysis detailing your home's value as well as a comparison with similar homes in the area
Home Values in the Area
Average Home Value in this Area
Purchase History
| Date | Buyer | Sale Price | Title Company |
|---|---|---|---|
| Hart Michael R | $180,000 | Burnet Title Llc | |
| Stoffel Brian R | -- | -- | |
| Stoffel Brian R | $145,000 | -- |
Source: Public Records
Mortgage History
| Date | Status | Borrower | Loan Amount |
|---|---|---|---|
| Open | Hart Michael R | $144,000 | |
| Previous Owner | Stoffel Brian R | $143,968 | |
| Closed | Hart Michael R | $17,800 |
Source: Public Records
Tax History Compared to Growth
Tax History
| Year | Tax Paid | Tax Assessment Tax Assessment Total Assessment is a certain percentage of the fair market value that is determined by local assessors to be the total taxable value of land and additions on the property. | Land | Improvement |
|---|---|---|---|---|
| 2024 | $6,956 | $82,490 | $11,017 | $71,473 |
| 2023 | $5,743 | $76,585 | $10,228 | $66,357 |
| 2022 | $5,743 | $63,153 | $10,725 | $52,428 |
| 2021 | $4,938 | $57,733 | $9,805 | $47,928 |
| 2020 | $4,781 | $56,314 | $9,564 | $46,750 |
| 2019 | $4,659 | $54,679 | $9,286 | $45,393 |
| 2018 | $4,243 | $49,934 | $8,685 | $41,249 |
| 2017 | $4,196 | $48,503 | $8,436 | $40,067 |
| 2016 | $4,062 | $46,343 | $8,060 | $38,283 |
| 2015 | $3,936 | $43,952 | $7,644 | $36,308 |
| 2014 | $4,522 | $51,079 | $7,547 | $43,532 |
| 2012 | $4,293 | $51,470 | $7,605 | $43,865 |
Source: Public Records
Map
Nearby Homes
- 964 Magnolia Ave
- 1048 Belle Plaine Ave
- 963 Belle Plaine Ave
- 1414 Belle Plaine Ave
- 35400 N Green Bay Rd
- 3627 Atlantic Ave
- 1430 N Green Bay Rd
- 3482 Ellis Ave
- 3210 W Grandview Ave
- 525 Lawrence Ave
- 12716 W Grandview Ave
- 12698 W Grandview Ave
- 34887 N Austin Ave
- 603 N Austin Ave
- 621 N Austin Ave
- 3947 Blackstone Ave
- 3436 Florida Ave
- 12933 W Polo Ave
- 3170 W Monroe St Unit 309
- 0 Ryan Rd
- 1022 Magnolia Ave
- 1048 Magnolia Ave
- 1035 Waveland Ave
- 1019 Waveland Ave
- 1047 Waveland Ave
- 3714 Grandville Ave
- 1029 Magnolia Ave
- 1066 Magnolia Ave
- 1047 Magnolia Ave
- 1061 Waveland Ave
- 1015 Magnolia Ave
- 1078 Magnolia Ave
- 1069 Magnolia Ave
- 1075 Waveland Ave
- 1032 Waveland Ave
- 1018 Waveland Ave
- 1046 Waveland Ave
- 989 Waveland Ave
- 3717 Grandmore Ave
- 3762 Grandville Ave