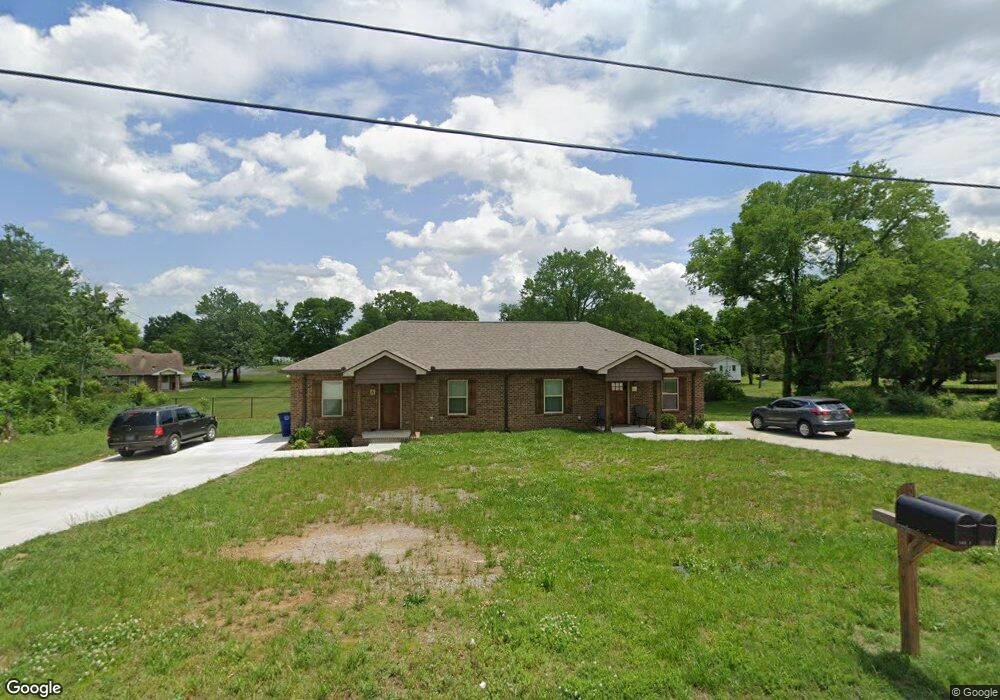
1034 Morton St Shelbyville, TN 37160
Estimated Value: $280,468 - $349,000
--
Bed
2
Baths
1,652
Sq Ft
$190/Sq Ft
Est. Value
About This Home
This home is located at 1034 Morton St, Shelbyville, TN 37160 and is currently estimated at $313,867, approximately $189 per square foot. 1034 Morton St is a home with nearby schools including Eakin Elementary School, Harris Middle School, and Victory Baptist Academy.
Ownership History
Date
Name
Owned For
Owner Type
Purchase Details
Closed on
Mar 15, 2023
Sold by
Curl Greg
Bought by
Bradford David
Current Estimated Value
Purchase Details
Closed on
Jan 14, 2021
Sold by
Curl Greg
Bought by
Bradford David
Home Financials for this Owner
Home Financials are based on the most recent Mortgage that was taken out on this home.
Original Mortgage
$175,000
Interest Rate
2.71%
Mortgage Type
Stand Alone Refi Refinance Of Original Loan
Purchase Details
Closed on
Jun 28, 2019
Sold by
Tillman Michael A and Tillman Lindon
Bought by
Curl Greg
Purchase Details
Closed on
Aug 4, 1999
Sold by
Bright Charles
Bought by
Tillman Michael
Purchase Details
Closed on
Feb 24, 1989
Bought by
Tillman Michael A
Purchase Details
Closed on
Apr 4, 1980
Bought by
Bright Charles
Create a Home Valuation Report for This Property
The Home Valuation Report is an in-depth analysis detailing your home's value as well as a comparison with similar homes in the area
Home Values in the Area
Average Home Value in this Area
Purchase History
| Date | Buyer | Sale Price | Title Company |
|---|---|---|---|
| Bradford David | -- | Absolute Title | |
| Bradford David | -- | Absolute Title | |
| Bradford David | -- | None Available | |
| Curl Greg | $15,000 | Absolute T&E Svcs Llc | |
| Tillman Michael | $3,150 | -- | |
| Tillman Michael A | $3,200 | -- | |
| Bright Charles | -- | -- |
Source: Public Records
Mortgage History
| Date | Status | Borrower | Loan Amount |
|---|---|---|---|
| Previous Owner | Bradford David | $175,000 |
Source: Public Records
Tax History Compared to Growth
Tax History
| Year | Tax Paid | Tax Assessment Tax Assessment Total Assessment is a certain percentage of the fair market value that is determined by local assessors to be the total taxable value of land and additions on the property. | Land | Improvement |
|---|---|---|---|---|
| 2025 | -- | $75,840 | $0 | $0 |
| 2024 | -- | $75,840 | $6,000 | $69,840 |
| 2023 | $2,885 | $75,840 | $6,000 | $69,840 |
| 2022 | $2,969 | $75,840 | $6,000 | $69,840 |
| 2021 | $134 | $3,750 | $3,750 | $0 |
| 2020 | $111 | $3,750 | $3,750 | $0 |
| 2019 | $111 | $2,500 | $2,500 | $0 |
| 2018 | $108 | $2,500 | $2,500 | $0 |
| 2017 | $108 | $2,500 | $2,500 | $0 |
| 2016 | $107 | $2,500 | $2,500 | $0 |
| 2015 | $107 | $2,500 | $2,500 | $0 |
| 2014 | $98 | $2,500 | $0 | $0 |
Source: Public Records
Map
Nearby Homes
- 312 Cottonwood Dr
- 1000 Woodbury St
- 130 Horseshoe Dr
- 102 Saddlewood Dr
- 0 Archery Ln
- 112 E Cedar St
- 129 Annas Way
- 0 Hilltop Rd Unit RTC2897754
- 0 Hilltop Rd Unit RTC3001632
- 115 Scotland Heights
- 1505 Green Ln
- 1507 Green Ln
- 402 Rose Ln
- 1017 Fairfield Pike
- 703 Deery St
- 114 Collier Ave
- 1523 Green Ln
- 1525 Green Ln
- 134 Butler St
- 636 Deery St
- 1030 Morton St
- 1030 Morton St
- 1028 Morton St Unit 1030
- 101 Lexington Cove
- 1031 Morton St
- 1029 Morton St
- 1026 Morton St
- 100 Lexington Cove
- 103 Lexington Cove
- 1042 Morton St
- 102 Lexington Cove
- 1025 Morton St
- 1022 Morton St
- 102 Lexington Cove Blvd
- 105 Lexington Cove
- 104 Lexington Cove
- 1044 Morton St
- 104 Lexington Cove Blvd
- 1043 Morton St
- 107 Lexington Cove