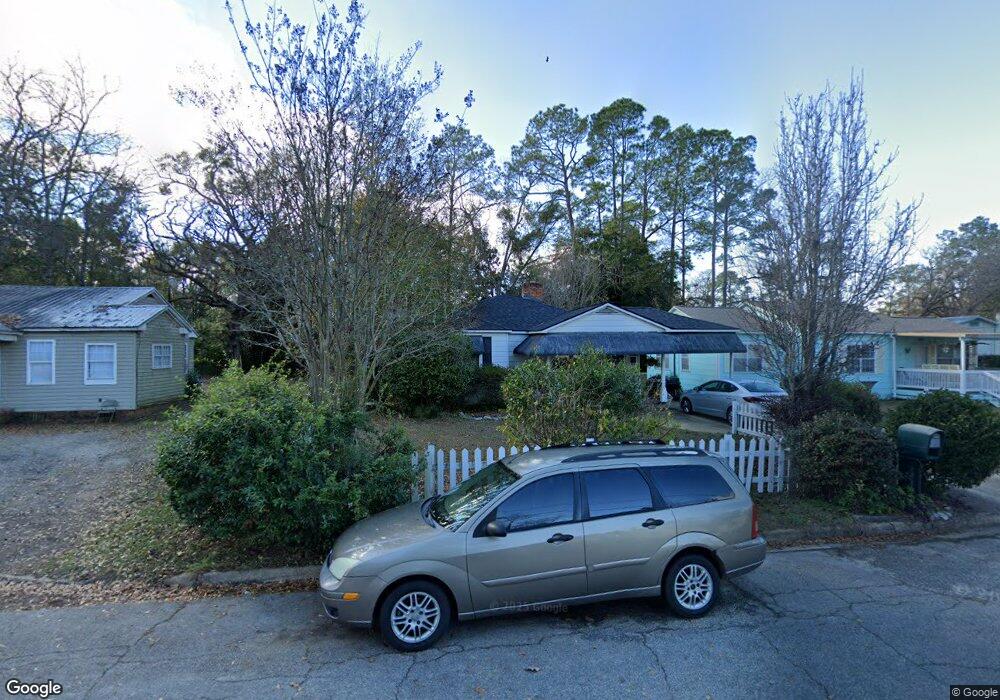
1034 Wisteria Dr Bainbridge, GA 39819
Estimated Value: $82,000 - $104,736
--
Bed
1
Bath
1,596
Sq Ft
$58/Sq Ft
Est. Value
About This Home
This home is located at 1034 Wisteria Dr, Bainbridge, GA 39819 and is currently estimated at $92,434, approximately $57 per square foot. 1034 Wisteria Dr is a home located in Decatur County with nearby schools including Bainbridge High School and Grace Christian Academy.
Ownership History
Date
Name
Owned For
Owner Type
Purchase Details
Closed on
Dec 23, 2019
Sold by
Hutchins Stacy E
Bought by
Smart Shanice
Current Estimated Value
Home Financials for this Owner
Home Financials are based on the most recent Mortgage that was taken out on this home.
Original Mortgage
$51,548
Outstanding Balance
$46,798
Interest Rate
5.25%
Mortgage Type
FHA
Estimated Equity
$45,637
Purchase Details
Closed on
Jul 18, 2014
Sold by
Gibson Robert D
Bought by
Hutchins Stacy E and Hutchins Sherry P
Home Financials for this Owner
Home Financials are based on the most recent Mortgage that was taken out on this home.
Original Mortgage
$35,000
Interest Rate
4.24%
Mortgage Type
New Conventional
Purchase Details
Closed on
Jul 17, 2014
Sold by
Citizens Bank
Bought by
Rathel Charles E and Rathel Susan G
Home Financials for this Owner
Home Financials are based on the most recent Mortgage that was taken out on this home.
Original Mortgage
$35,000
Interest Rate
4.24%
Mortgage Type
New Conventional
Create a Home Valuation Report for This Property
The Home Valuation Report is an in-depth analysis detailing your home's value as well as a comparison with similar homes in the area
Home Values in the Area
Average Home Value in this Area
Purchase History
| Date | Buyer | Sale Price | Title Company |
|---|---|---|---|
| Smart Shanice | $52,500 | -- | |
| Hutchins Stacy E | $35,000 | -- | |
| Rathel Charles E | $20,000 | -- |
Source: Public Records
Mortgage History
| Date | Status | Borrower | Loan Amount |
|---|---|---|---|
| Open | Smart Shanice | $51,548 | |
| Previous Owner | Hutchins Stacy E | $35,000 |
Source: Public Records
Tax History Compared to Growth
Tax History
| Year | Tax Paid | Tax Assessment Tax Assessment Total Assessment is a certain percentage of the fair market value that is determined by local assessors to be the total taxable value of land and additions on the property. | Land | Improvement |
|---|---|---|---|---|
| 2024 | $872 | $29,368 | $1,412 | $27,956 |
| 2023 | $383 | $29,368 | $1,412 | $27,956 |
| 2022 | $851 | $29,368 | $1,412 | $27,956 |
| 2021 | $779 | $26,352 | $1,412 | $24,940 |
| 2020 | $689 | $22,352 | $1,412 | $20,940 |
| 2019 | $623 | $17,943 | $1,412 | $16,531 |
| 2018 | $616 | $17,943 | $1,412 | $16,531 |
| 2017 | $567 | $16,213 | $1,395 | $14,818 |
| 2016 | $567 | $16,213 | $1,395 | $14,818 |
| 2015 | $503 | $16,213 | $1,395 | $14,818 |
| 2014 | $681 | $14,000 | $884 | $13,116 |
| 2013 | -- | $22,101 | $1,395 | $20,706 |
Source: Public Records
Map
Nearby Homes
- Lot 20 Seminole Ridge Subdivision
- TBD LOT 1 Seminole Ridge S D
- 539 Lake Douglas Drive Ext Dr
- 1205 Tallahassee Rd
- lot 27 SW Lot 27 River Chase S D
- 628 S Monroe St
- 1800 S West St
- 632 E Evans St
- 603 Fleming St
- 409 E Evans St
- 309 E Evans St
- 414 S Broad St
- 910 E Pine St
- 210 W Evans St
- 306 S Broad St
- 212 Michaels Way
- 249 Meredith Dr
- 245 Meredith Dr
- Lot 3 Mountain View Way
- 0000 Mountain View Way
- 1036 Wisteria Dr
- 1032 Wisteria Dr
- 1039 S Japonica Dr
- 408 Circle Dr
- 1047 Wisteria Dr
- 1037 S Japonica Dr
- 1041 S Japonica Dr
- 1029 S Japonica Dr
- 1045 Wisteria Dr
- 1049 Wisteria Dr
- 403 E Louise St
- 1043 Wisteria Dr
- 407 E Louise St
- 405 E Louise St
- 409 E Louise St
- 1039 Wisteria Dr
- 0000 Japonica Anderson Sharpe Broughton
- 411 E Louise St
- 1026 S Japonica Dr
- 401 E Louise St