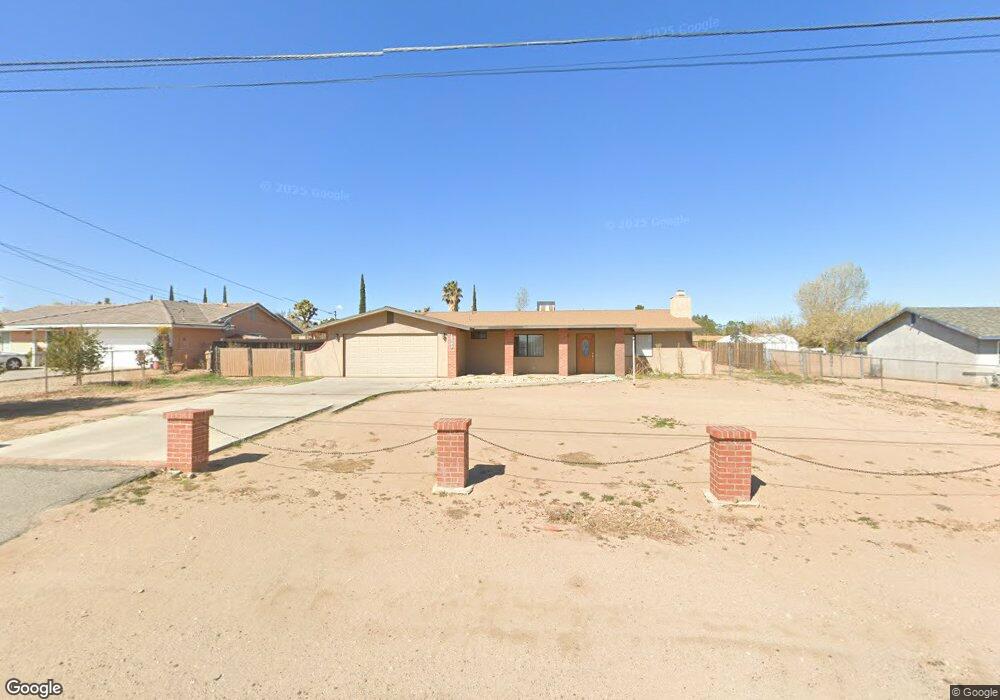
10342 Locust Ave Hesperia, CA 92345
Lucky Star Ranchos NeighborhoodEstimated Value: $382,000 - $421,000
3
Beds
2
Baths
1,416
Sq Ft
$280/Sq Ft
Est. Value
About This Home
This home is located at 10342 Locust Ave, Hesperia, CA 92345 and is currently estimated at $395,938, approximately $279 per square foot. 10342 Locust Ave is a home located in San Bernardino County with nearby schools including Maple Elementary School, Hesperia Junior High School, and Hesperia High School.
Ownership History
Date
Name
Owned For
Owner Type
Purchase Details
Closed on
Apr 17, 2020
Sold by
Segura Mark E
Bought by
Segura Mark E and Revocable Living Trust Of Mark
Current Estimated Value
Purchase Details
Closed on
Oct 22, 2011
Sold by
Colwell Barlow Jennifer
Bought by
Segura Mark E
Purchase Details
Closed on
Oct 5, 2011
Sold by
Markloff Curtis A
Bought by
Colwell Barlow Jennifer Lynn
Purchase Details
Closed on
May 10, 2005
Sold by
Sharon Kerry S
Bought by
Markloff Curtis A and Markloff Shalom
Home Financials for this Owner
Home Financials are based on the most recent Mortgage that was taken out on this home.
Original Mortgage
$169,600
Interest Rate
5.72%
Mortgage Type
Stand Alone First
Purchase Details
Closed on
May 11, 2000
Sold by
Phares Lois
Bought by
Sharon Kerry S and Bates Sharon Alexandra M
Home Financials for this Owner
Home Financials are based on the most recent Mortgage that was taken out on this home.
Original Mortgage
$85,680
Interest Rate
8.27%
Mortgage Type
VA
Create a Home Valuation Report for This Property
The Home Valuation Report is an in-depth analysis detailing your home's value as well as a comparison with similar homes in the area
Home Values in the Area
Average Home Value in this Area
Purchase History
| Date | Buyer | Sale Price | Title Company |
|---|---|---|---|
| Segura Mark E | -- | None Available | |
| Segura Mark E | $58,000 | None Available | |
| Colwell Barlow Jennifer Lynn | $58,000 | Stewart Title Of California | |
| Markloff Curtis A | $212,000 | First American | |
| Sharon Kerry S | $84,000 | Stewart Title |
Source: Public Records
Mortgage History
| Date | Status | Borrower | Loan Amount |
|---|---|---|---|
| Previous Owner | Markloff Curtis A | $169,600 | |
| Previous Owner | Sharon Kerry S | $85,680 |
Source: Public Records
Tax History
| Year | Tax Paid | Tax Assessment Tax Assessment Total Assessment is a certain percentage of the fair market value that is determined by local assessors to be the total taxable value of land and additions on the property. | Land | Improvement |
|---|---|---|---|---|
| 2025 | $871 | $72,851 | $21,856 | $50,995 |
| 2024 | $853 | $71,422 | $21,427 | $49,995 |
| 2023 | $844 | $70,022 | $21,007 | $49,015 |
| 2022 | $826 | $68,649 | $20,595 | $48,054 |
| 2021 | $812 | $67,303 | $20,191 | $47,112 |
| 2020 | $803 | $66,613 | $19,984 | $46,629 |
| 2019 | $787 | $65,307 | $19,592 | $45,715 |
| 2018 | $773 | $64,027 | $19,208 | $44,819 |
| 2017 | $760 | $62,771 | $18,831 | $43,940 |
| 2016 | $745 | $61,540 | $18,462 | $43,078 |
| 2015 | $736 | $60,616 | $18,185 | $42,431 |
| 2014 | $727 | $59,429 | $17,829 | $41,600 |
Source: Public Records
Map
Nearby Homes
- 10312 Hawthorne Ave
- 15017 Cashew St
- 10278 Balsam Ave
- 15120 Live Oak St
- 9960 Cottonwood Ave
- 10643 Redwood Ave
- 10401 Victor Ave
- 10219 Victor Ave
- 9925 Balsam Ave
- 10753 Locust Ave
- 9925 Redwood Ave
- 10784 Kern Ave
- 0 Victor Ave Unit IV25272662
- 15572 Riverside St
- 10671 Pinon Ave
- 14585 Mauna Loa St
- 15120 Main St
- 9814 Oakwood Ave
- 14465 Linden St
- 15759 Hercules St
- 10350 Locust Ave
- 10328 Locust Ave
- 10341 Kern Ave
- 10374 Locust Ave
- 10312 Locust Ave
- 10327 Kern Ave
- 10357 Kern Ave
- 10341 Locust Ave
- 10357 Locust Ave
- 10327 Locust Ave
- 10311 Kern Ave
- 10373 Kern Ave
- 10386 Locust Ave
- 10292 Locust Ave
- 10373 Locust Ave
- 10311 Locust Ave
- 10291 Kern Ave
- 10387 Kern Ave
- 10387 Locust Ave
- 10404 Locust Ave
Your Personal Tour Guide
Ask me questions while you tour the home.