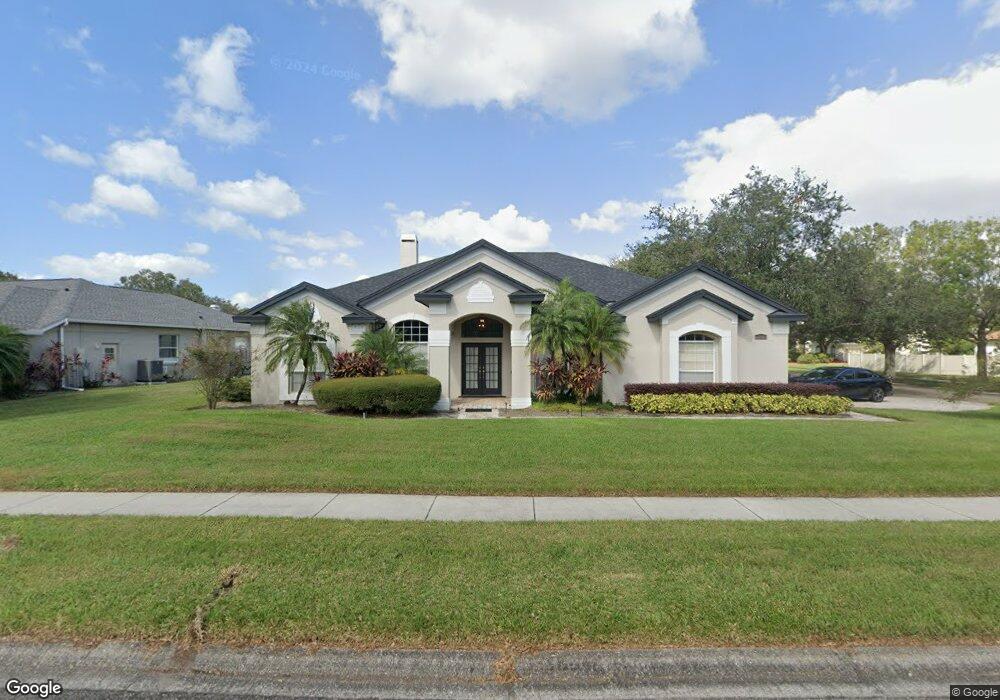
10349 Pointview Ct Orlando, FL 32836
Dr. Phillips NeighborhoodEstimated Value: $643,917 - $691,000
4
Beds
3
Baths
2,108
Sq Ft
$315/Sq Ft
Est. Value
About This Home
This home is located at 10349 Pointview Ct, Orlando, FL 32836 and is currently estimated at $663,229, approximately $314 per square foot. 10349 Pointview Ct is a home located in Orange County with nearby schools including Sand Lake Elementary School, Southwest Middle, and Muslim Academy Of Greater Orlando.
Ownership History
Date
Name
Owned For
Owner Type
Purchase Details
Closed on
Dec 5, 2018
Sold by
Mi Piojita Llc
Bought by
10349 Piojita Llc
Current Estimated Value
Purchase Details
Closed on
Sep 17, 2007
Sold by
Cox Daniel E and Cox Holly
Bought by
Mi Piojita Llc
Purchase Details
Closed on
Nov 15, 2005
Sold by
Pointek Julie A
Bought by
Cox Daniel E
Home Financials for this Owner
Home Financials are based on the most recent Mortgage that was taken out on this home.
Original Mortgage
$313,600
Interest Rate
6.19%
Mortgage Type
Fannie Mae Freddie Mac
Purchase Details
Closed on
Feb 21, 1996
Sold by
Development & Construction Inc
Bought by
Piontek Julie A
Home Financials for this Owner
Home Financials are based on the most recent Mortgage that was taken out on this home.
Original Mortgage
$140,850
Interest Rate
7.03%
Mortgage Type
New Conventional
Create a Home Valuation Report for This Property
The Home Valuation Report is an in-depth analysis detailing your home's value as well as a comparison with similar homes in the area
Home Values in the Area
Average Home Value in this Area
Purchase History
| Date | Buyer | Sale Price | Title Company |
|---|---|---|---|
| 10349 Piojita Llc | -- | Attorney | |
| Mi Piojita Llc | $440,000 | Equitable Title Svcs Ltd #4 | |
| Cox Daniel E | $448,000 | Icon Title Agency Llc | |
| Piontek Julie A | $53,000 | -- | |
| Dye Construction And Development In | $42,600 | -- |
Source: Public Records
Mortgage History
| Date | Status | Borrower | Loan Amount |
|---|---|---|---|
| Previous Owner | Cox Daniel E | $313,600 | |
| Previous Owner | Dye Construction And Development In | $140,850 |
Source: Public Records
Tax History
| Year | Tax Paid | Tax Assessment Tax Assessment Total Assessment is a certain percentage of the fair market value that is determined by local assessors to be the total taxable value of land and additions on the property. | Land | Improvement |
|---|---|---|---|---|
| 2025 | $9,027 | $541,950 | $120,000 | $421,950 |
| 2024 | $7,486 | $500,132 | -- | -- |
| 2023 | $7,486 | $499,498 | $120,000 | $379,498 |
| 2022 | $6,568 | $415,149 | $120,000 | $295,149 |
| 2021 | $5,858 | $341,596 | $100,000 | $241,596 |
| 2020 | $5,636 | $338,927 | $95,000 | $243,927 |
| 2019 | $5,738 | $326,258 | $80,000 | $246,258 |
| 2018 | $5,718 | $321,052 | $80,000 | $241,052 |
| 2017 | $5,676 | $315,974 | $80,000 | $235,974 |
| 2016 | $5,669 | $310,188 | $80,000 | $230,188 |
| 2015 | $5,474 | $291,629 | $80,000 | $211,629 |
| 2014 | $5,239 | $279,790 | $80,000 | $199,790 |
Source: Public Records
Map
Nearby Homes
- 10240 Pointview Ct
- 7451 Pointe Venezia Dr
- 7415 Pointe Venezia Dr
- 10125 Foxhurst Ct
- 7414 Pointe Venezia Dr
- 7823 Fernleaf Dr
- 10118 Shortwood Ln
- 7824 Fernleaf Dr
- 7909 Fernleaf Dr
- 10116 Facet Ct
- 10232 Turkey Lake Rd Unit 180
- 10303 Newington Dr
- 7741 Pointview Cir
- 8038 Glitter Ct
- 9143 Southern Breeze Dr
- 8419 Pippen Dr
- 8419 Karwick St
- 9233 Southern Breeze Dr
- 8324 Ludington Cir
- 9245 Southern Breeze Dr
- 10343 Pointview Ct
- 10228 Lundy Ct
- 10401 Pointview Ct Unit 4
- 10233 Leeds Ct
- 10342 Pointview Ct
- 10348 Pointview Ct
- 10222 Lundy Ct
- 10227 Leeds Ct Unit IV
- 10402 Pointview Ct
- 10221 Lundy Ct
- 10336 Pointview Ct
- 10309 Luton Ct
- 10216 Lundy Ct
- 10221 Leeds Ct
- 10330 Pointview Ct
- 10408 Pointview Ct
- 10319 Pointview Ct
- 10427 Pointview Ct
- 10215 Leeds Ct Unit IV
Your Personal Tour Guide
Ask me questions while you tour the home.