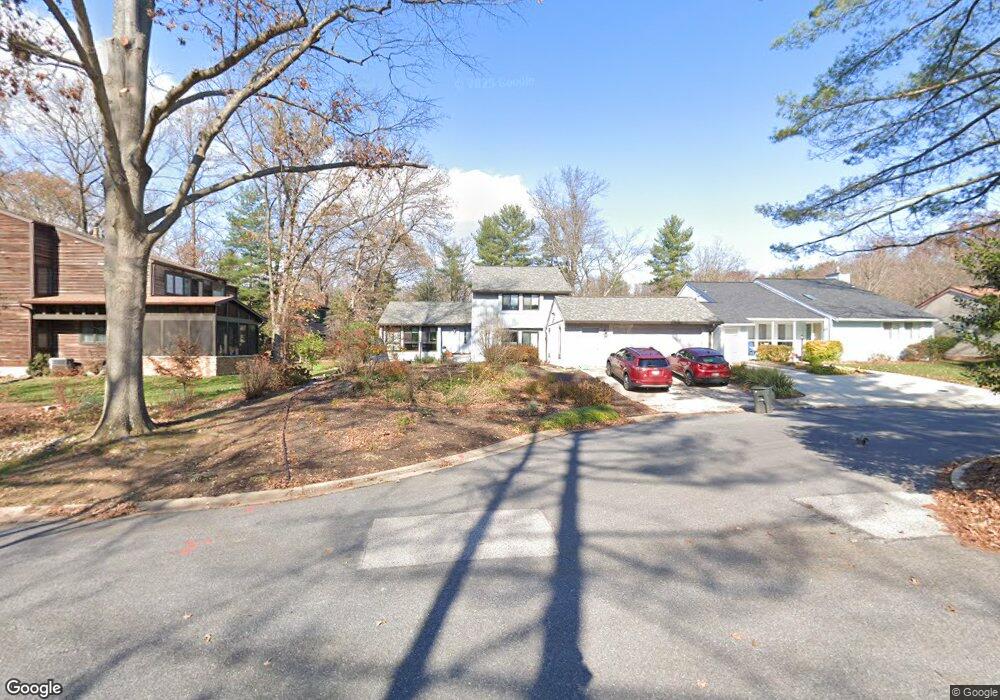
10349 Sixpence Cir Columbia, MD 21044
Hickory Ridge NeighborhoodEstimated Value: $698,000 - $839,000
--
Bed
3
Baths
2,379
Sq Ft
$312/Sq Ft
Est. Value
About This Home
This home is located at 10349 Sixpence Cir, Columbia, MD 21044 and is currently estimated at $741,152, approximately $311 per square foot. 10349 Sixpence Cir is a home located in Howard County with nearby schools including Clemens Crossing Elementary School, Wilde Lake Middle, and Atholton High School.
Ownership History
Date
Name
Owned For
Owner Type
Purchase Details
Closed on
Jan 17, 2006
Sold by
Blickle E Sean
Bought by
Hannan Stephen D and Robeson Lynn A
Current Estimated Value
Home Financials for this Owner
Home Financials are based on the most recent Mortgage that was taken out on this home.
Original Mortgage
$456,000
Outstanding Balance
$256,458
Interest Rate
6.28%
Mortgage Type
Purchase Money Mortgage
Estimated Equity
$484,694
Purchase Details
Closed on
Dec 29, 2005
Sold by
Blickle E Sean
Bought by
Hannan Stephen D and Robeson Lynn A
Home Financials for this Owner
Home Financials are based on the most recent Mortgage that was taken out on this home.
Original Mortgage
$456,000
Outstanding Balance
$256,458
Interest Rate
6.28%
Mortgage Type
Purchase Money Mortgage
Estimated Equity
$484,694
Purchase Details
Closed on
Jan 21, 1998
Sold by
Blickle E Sean
Bought by
Blickle E Sean E and Blickle Marilyn J
Purchase Details
Closed on
Jan 8, 1998
Sold by
Chow I Peng
Bought by
Blackle E Sean
Create a Home Valuation Report for This Property
The Home Valuation Report is an in-depth analysis detailing your home's value as well as a comparison with similar homes in the area
Home Values in the Area
Average Home Value in this Area
Purchase History
| Date | Buyer | Sale Price | Title Company |
|---|---|---|---|
| Hannan Stephen D | $570,000 | -- | |
| Hannan Stephen D | $570,000 | -- | |
| Blickle E Sean E | -- | -- | |
| Blackle E Sean | $200,000 | -- |
Source: Public Records
Mortgage History
| Date | Status | Borrower | Loan Amount |
|---|---|---|---|
| Open | Hannan Stephen D | $456,000 | |
| Closed | Hannan Stephen D | $456,000 | |
| Closed | Blackle E Sean | -- |
Source: Public Records
Tax History Compared to Growth
Tax History
| Year | Tax Paid | Tax Assessment Tax Assessment Total Assessment is a certain percentage of the fair market value that is determined by local assessors to be the total taxable value of land and additions on the property. | Land | Improvement |
|---|---|---|---|---|
| 2025 | $8,076 | $550,967 | $0 | $0 |
| 2024 | $8,076 | $532,000 | $267,300 | $264,700 |
| 2023 | $7,554 | $503,600 | $0 | $0 |
| 2022 | $7,168 | $475,200 | $0 | $0 |
| 2021 | $6,655 | $446,800 | $227,100 | $219,700 |
| 2020 | $6,655 | $434,233 | $0 | $0 |
| 2019 | $6,474 | $421,667 | $0 | $0 |
| 2018 | $5,969 | $409,100 | $170,800 | $238,300 |
| 2017 | $5,939 | $409,100 | $0 | $0 |
| 2016 | $1,384 | $407,767 | $0 | $0 |
| 2015 | $1,384 | $407,100 | $0 | $0 |
| 2014 | $1,360 | $407,100 | $0 | $0 |
Source: Public Records
Map
Nearby Homes
- 10432 Schoolmaster Place
- 10397 Blue Arrow Ct
- 10426 Fair Oaks
- 10457 Sternwheel Place
- 10195 Owen Brown Rd
- 10722 Hidden Ridge Dr
- 6426 Beechwood Dr
- 10330 College Square
- 10522 E Wind Way
- 6722 Seneca Dr
- 10637 High Beam Ct
- 10153 Cape Ann Dr
- 10966 Shadow Ln
- 5832 Wyndham Cir
- 5814 Wyndham Cir
- 6725 Pine Dr
- 10145 Goodin Cir
- 6114 Camelback Ln
- 6803 Green Mill Way
- 6009 Wild Ginger Ct
- 10353 Sixpence Cir
- 10345 Sixpence Cir
- 10325 Sixpence Cir
- 10357 Sixpence Cir
- 10361 Sixpence Cir
- 10321 Log Raft
- 10320 Log Raft
- 10350 Sixpence Cir
- 10316 Whitewasher Way
- 10346 Sixpence Cir
- 10354 Sixpence Cir
- 10320 Whitewasher Way
- 10358 Sixpence Cir
- 10325 Log Raft
- 10324 Log Raft
- 10330 Sixpence Cir
- 10326 Sixpence Cir
- 10334 Launcelot Ln
- 10338 Sixpence Cir
- 10326 Whitewasher Way