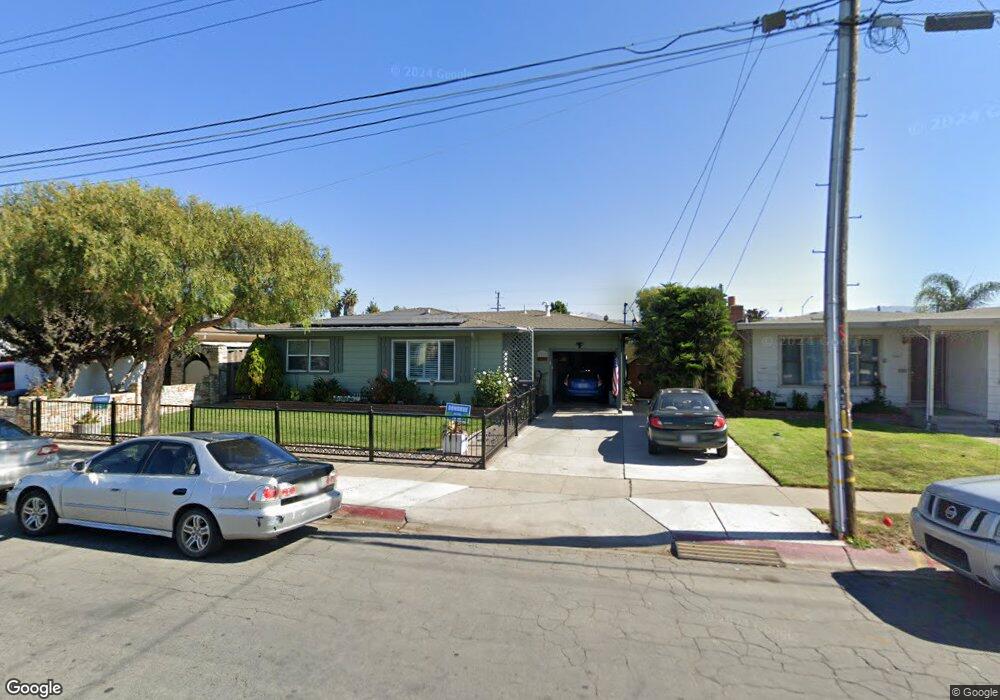
1035 Alma Ave Salinas, CA 93905
East Salinas NeighborhoodEstimated Value: $530,618 - $604,000
2
Beds
1
Bath
914
Sq Ft
$624/Sq Ft
Est. Value
About This Home
This home is located at 1035 Alma Ave, Salinas, CA 93905 and is currently estimated at $570,405, approximately $624 per square foot. 1035 Alma Ave is a home located in Monterey County with nearby schools including Dr. Martin Luther King, Jr. Academy, El Sausal Middle School, and Alisal High School.
Ownership History
Date
Name
Owned For
Owner Type
Purchase Details
Closed on
Sep 15, 2015
Sold by
Bynum Victoria A
Bought by
Bynum Victoria Alice and The Victoria Bynum Living Trust
Current Estimated Value
Purchase Details
Closed on
May 26, 2005
Sold by
Meeks John E and Bynum Victoria A
Bought by
Meeks John E and Bynum Victoria A
Purchase Details
Closed on
Jan 19, 2005
Sold by
Meeks Donald E
Bought by
Meeks John E and Bynum Victoria A
Create a Home Valuation Report for This Property
The Home Valuation Report is an in-depth analysis detailing your home's value as well as a comparison with similar homes in the area
Home Values in the Area
Average Home Value in this Area
Purchase History
| Date | Buyer | Sale Price | Title Company |
|---|---|---|---|
| Bynum Victoria Alice | -- | None Available | |
| Meeks John E | -- | None Available | |
| Meeks John E | -- | None Available | |
| Meeks John E | -- | -- | |
| Meeks John E | -- | -- |
Source: Public Records
Tax History
| Year | Tax Paid | Tax Assessment Tax Assessment Total Assessment is a certain percentage of the fair market value that is determined by local assessors to be the total taxable value of land and additions on the property. | Land | Improvement |
|---|---|---|---|---|
| 2025 | $789 | $63,565 | $14,605 | $48,960 |
| 2024 | $789 | $62,319 | $14,319 | $48,000 |
| 2023 | $772 | $61,098 | $14,039 | $47,059 |
| 2022 | $695 | $59,901 | $13,764 | $46,137 |
| 2021 | $692 | $58,728 | $13,495 | $45,233 |
| 2020 | $684 | $58,127 | $13,357 | $44,770 |
| 2019 | $700 | $56,989 | $13,096 | $43,893 |
| 2018 | $657 | $55,873 | $12,840 | $43,033 |
| 2017 | $679 | $54,779 | $12,589 | $42,190 |
| 2016 | $643 | $53,706 | $12,343 | $41,363 |
| 2015 | $636 | $52,900 | $12,158 | $40,742 |
| 2014 | $614 | $51,864 | $11,920 | $39,944 |
Source: Public Records
Map
Nearby Homes
- 933 Acosta Plaza Unit 35
- 948 Rider Ave
- 1046 C St
- 11 E Laurel Dr
- 11 Hill Cir
- 755 Pino Way
- 609 Saint George Dr
- 11 Fresa Place
- 544 Saint George Dr
- 320 N Sanborn Rd
- 230 Paloma Ave
- 724 Circle Dr
- 1094 Twin Creeks Dr
- 1049 Twin Creeks Dr
- 129 N Filice St
- 1215 Campania Way
- 18 Hancock Cir
- 1544 Saguaro Dr Unit 4
- 78 Ragsdale Ct
- 11 Saguaro Cir
Your Personal Tour Guide
Ask me questions while you tour the home.