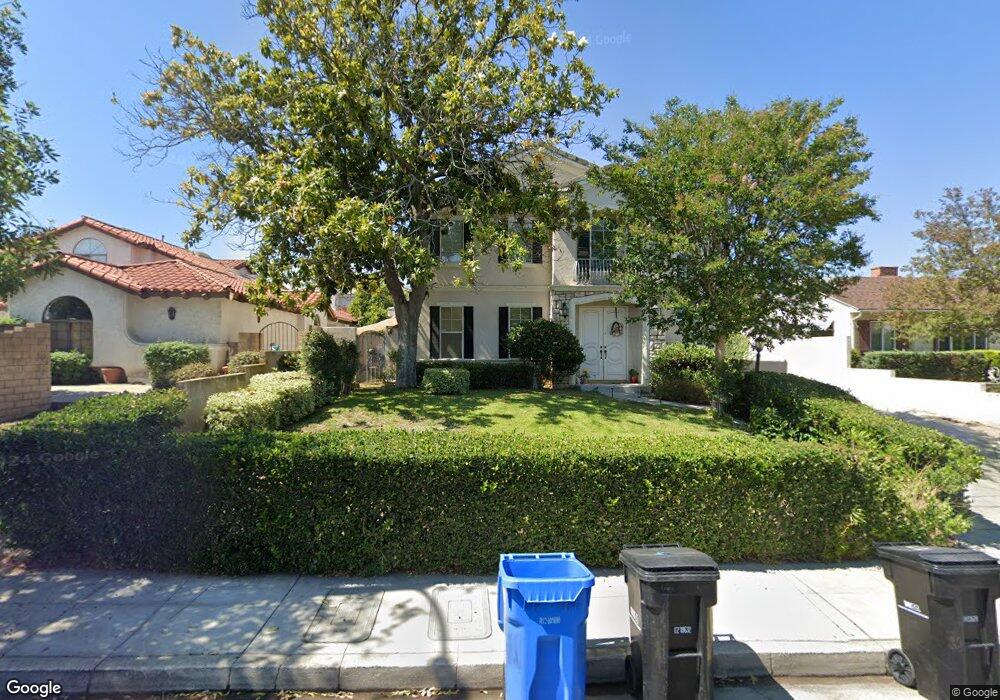
1035 Fairview Ave Unit B Arcadia, CA 91007
Estimated Value: $1,133,252 - $1,224,000
3
Beds
3
Baths
2,072
Sq Ft
$576/Sq Ft
Est. Value
About This Home
This home is located at 1035 Fairview Ave Unit B, Arcadia, CA 91007 and is currently estimated at $1,192,813, approximately $575 per square foot. 1035 Fairview Ave Unit B is a home located in Los Angeles County with nearby schools including Hugo Reid Elementary School, Foothills Middle School, and Arcadia High School.
Ownership History
Date
Name
Owned For
Owner Type
Purchase Details
Closed on
May 5, 2010
Sold by
Wei Ke Ping
Bought by
Chang Chung and Wong Cindy H
Current Estimated Value
Home Financials for this Owner
Home Financials are based on the most recent Mortgage that was taken out on this home.
Original Mortgage
$510,000
Interest Rate
4.68%
Mortgage Type
New Conventional
Purchase Details
Closed on
Jul 30, 2003
Sold by
Kim Daniel S and Wang Huai Jun
Bought by
Wei Ke Ping
Home Financials for this Owner
Home Financials are based on the most recent Mortgage that was taken out on this home.
Original Mortgage
$315,000
Interest Rate
6.3%
Mortgage Type
Purchase Money Mortgage
Purchase Details
Closed on
Feb 12, 2003
Sold by
Pacific Eagle Investments
Bought by
Kim Daniel S
Home Financials for this Owner
Home Financials are based on the most recent Mortgage that was taken out on this home.
Original Mortgage
$370,000
Interest Rate
5.25%
Create a Home Valuation Report for This Property
The Home Valuation Report is an in-depth analysis detailing your home's value as well as a comparison with similar homes in the area
Home Values in the Area
Average Home Value in this Area
Purchase History
| Date | Buyer | Sale Price | Title Company |
|---|---|---|---|
| Chang Chung | $685,000 | Fidelity National Title Co | |
| Wei Ke Ping | $515,000 | Fidelity National Title Co | |
| Kim Daniel S | $462,500 | Fidelity National Title Co |
Source: Public Records
Mortgage History
| Date | Status | Borrower | Loan Amount |
|---|---|---|---|
| Previous Owner | Chang Chung | $510,000 | |
| Previous Owner | Wei Ke Ping | $315,000 | |
| Previous Owner | Kim Daniel S | $370,000 |
Source: Public Records
Tax History
| Year | Tax Paid | Tax Assessment Tax Assessment Total Assessment is a certain percentage of the fair market value that is determined by local assessors to be the total taxable value of land and additions on the property. | Land | Improvement |
|---|---|---|---|---|
| 2025 | $9,949 | $877,592 | $574,472 | $303,120 |
| 2024 | $9,949 | $860,385 | $563,208 | $297,177 |
| 2023 | $9,743 | $843,515 | $552,165 | $291,350 |
| 2022 | $9,424 | $826,977 | $541,339 | $285,638 |
| 2021 | $9,249 | $810,763 | $530,725 | $280,038 |
| 2019 | $9,026 | $786,718 | $514,985 | $271,733 |
| 2018 | $8,803 | $771,293 | $504,888 | $266,405 |
| 2016 | $8,578 | $741,345 | $485,284 | $256,061 |
| 2015 | $8,430 | $730,210 | $477,995 | $252,215 |
| 2014 | $8,313 | $715,907 | $468,632 | $247,275 |
Source: Public Records
Map
Nearby Homes
- 905 Sunset Blvd Unit A
- 946 Fairview Ave Unit 8
- 1126 Fairview Ave Unit 210
- 1126 Fairview Ave Unit 106
- 1124 W Huntington Dr Unit 2
- 1058 Sunset Blvd Unit B
- 1037 Sunset Blvd Unit B
- 1088 Sunset Blvd Unit A
- 1122 Arcadia Ave Unit D
- 9160 Huntington Dr
- 1140 Arcadia Ave
- 912 Arcadia Ave Unit 6
- 1156 Arcadia Ave Unit 5
- 9144 E Fairview Ave
- 905 W Duarte Rd Unit A
- 1228 Temple City Blvd
- 1222 Temple City Blvd
- 731 S Michillinda Ave
- 849 W Huntington Dr
- 853 W Huntington Dr Unit B
- 1035 Fairview Ave
- 1035 Fairview Ave Unit A
- 1031 Fairview Ave
- 1049 Fairview Ave Unit 4
- 1049 Fairview Ave Unit 3
- 1049 Fairview Ave Unit 2
- 1049 Fairview Ave Unit 1
- 1025 Fairview Ave Unit 3
- 1025 Fairview Ave Unit 2
- 928 Sunset Blvd Unit 14
- 926 Sunset Blvd Unit 7
- 918 Sunset Blvd Unit B
- 918 Sunset Blvd Unit A
- 916 Sunset Blvd Unit 4
- 908 Sunset Blvd
- 906 Sunset Blvd
- 900 Sunset Blvd Unit 1
- 946 Sunset Blvd
- 948 Sunset Blvd Unit 10
- 958 Sunset Blvd Unit 8
Your Personal Tour Guide
Ask me questions while you tour the home.