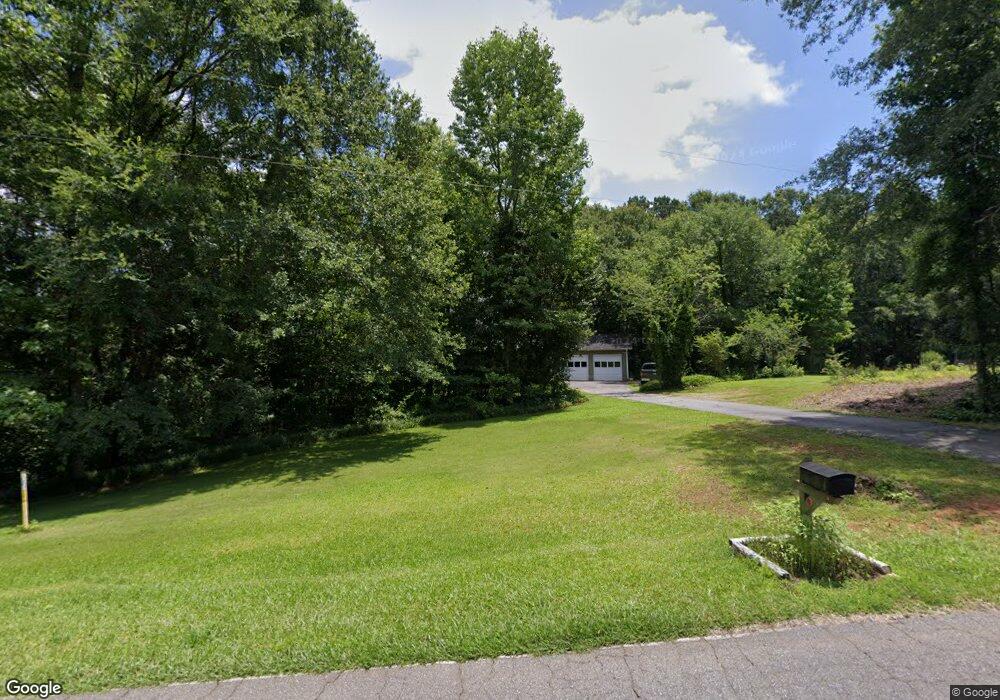
1035 Finch Rd Winder, GA 30680
Estimated Value: $345,000 - $404,000
4
Beds
3
Baths
1,825
Sq Ft
$202/Sq Ft
Est. Value
About This Home
This home is located at 1035 Finch Rd, Winder, GA 30680 and is currently estimated at $369,548, approximately $202 per square foot. 1035 Finch Rd is a home located in Barrow County with nearby schools including Statham Elementary School, Bear Creek Middle School, and Winder-Barrow High School.
Ownership History
Date
Name
Owned For
Owner Type
Purchase Details
Closed on
May 25, 2007
Sold by
Hsbc Bk Usa
Bought by
Fuller Jacob P and Fuller June M
Current Estimated Value
Home Financials for this Owner
Home Financials are based on the most recent Mortgage that was taken out on this home.
Original Mortgage
$129,600
Outstanding Balance
$78,789
Interest Rate
6.16%
Mortgage Type
New Conventional
Estimated Equity
$290,759
Purchase Details
Closed on
Dec 5, 2006
Sold by
Potter Bobby J
Bought by
Hsbc Bk Usa
Home Financials for this Owner
Home Financials are based on the most recent Mortgage that was taken out on this home.
Original Mortgage
$32,400
Interest Rate
6.16%
Mortgage Type
New Conventional
Purchase Details
Closed on
Mar 25, 2005
Sold by
Potter Bobby Jewell
Bought by
Potter Bobby J
Purchase Details
Closed on
May 2, 1989
Bought by
Potter Bobby Jewell
Create a Home Valuation Report for This Property
The Home Valuation Report is an in-depth analysis detailing your home's value as well as a comparison with similar homes in the area
Home Values in the Area
Average Home Value in this Area
Purchase History
| Date | Buyer | Sale Price | Title Company |
|---|---|---|---|
| Fuller Jacob P | $162,000 | -- | |
| Hsbc Bk Usa | $197,100 | -- | |
| Hsbc Bank Usa | -- | -- | |
| Potter Bobby J | -- | -- | |
| Potter Bobby Jewell | $147,000 | -- |
Source: Public Records
Mortgage History
| Date | Status | Borrower | Loan Amount |
|---|---|---|---|
| Open | Fuller Jacob P | $129,600 | |
| Previous Owner | Hsbc Bank Usa | $32,400 |
Source: Public Records
Tax History Compared to Growth
Tax History
| Year | Tax Paid | Tax Assessment Tax Assessment Total Assessment is a certain percentage of the fair market value that is determined by local assessors to be the total taxable value of land and additions on the property. | Land | Improvement |
|---|---|---|---|---|
| 2024 | $2,394 | $100,065 | $16,000 | $84,065 |
| 2023 | $1,971 | $100,065 | $16,000 | $84,065 |
| 2022 | $2,145 | $78,194 | $16,000 | $62,194 |
| 2021 | $1,991 | $69,061 | $12,000 | $57,061 |
| 2020 | $2,043 | $70,728 | $18,800 | $51,928 |
| 2019 | $2,042 | $69,508 | $18,800 | $50,708 |
| 2018 | $2,016 | $69,508 | $18,800 | $50,708 |
| 2017 | $1,847 | $63,432 | $18,800 | $44,632 |
| 2016 | $1,771 | $62,487 | $18,800 | $43,687 |
| 2015 | $1,797 | $63,065 | $18,800 | $44,265 |
| 2014 | $1,548 | $54,054 | $9,212 | $44,842 |
| 2013 | -- | $51,512 | $9,212 | $42,300 |
Source: Public Records
Map
Nearby Homes
- 1212 Highway 211 NE
- 1226 Highway 211 NE
- 212 Rainbow Ln
- 1206 Corkybrooke Ln
- 385 Finch Landing Rd
- 1553 Shoal Creek Dr
- 1556 Shoal Creek Dr
- 917 Justin Dr Unit 3
- 1431 Solomon Dr
- 330 Anchors Way
- 388 Kay Dr Unit 1
- 1023 Solomon Ct
- 1453 Solomon Dr
- 508 Pleasant Hill Church Rd NE
- 0 Hancock Bridge Rd Unit 10535063
- 63 Delightful Way Unit 1
- 130 (Tract 1) Bowman Mill Rd NE
- 203 Delightful Way Unit 5
- 162 Delightful Way Unit 28
- 253 Delightful Way Unit 6
- 1026 Finch Rd
- 1023 Finch Rd
- 1046 Finch Rd Unit 2
- 1013 Finch Rd
- 1014 Finch Rd
- 1056 Finch Rd
- 1249 Highway 211 NE Unit 2
- 1249 Highway 211 NE Unit 3
- 1249 Highway 211 NE Unit 1
- 1249 Highway 211 NE Unit 3
- 1249 Highway 211 NE Unit 2
- 1249 Highway 211 NE Unit 1
- 1249 Highway 211 NE
- 1249 Highway 211 NE
- 1249 Highway 211 NE
- 1249 Highway 211 NE
- 1201 Clearwater Dr Unit Lot 1
- 1201 Clearwater Dr
- 207 Clearsprings Ln Unit LOT 4
- 207 Clearsprings Ln Unit Lot 4A