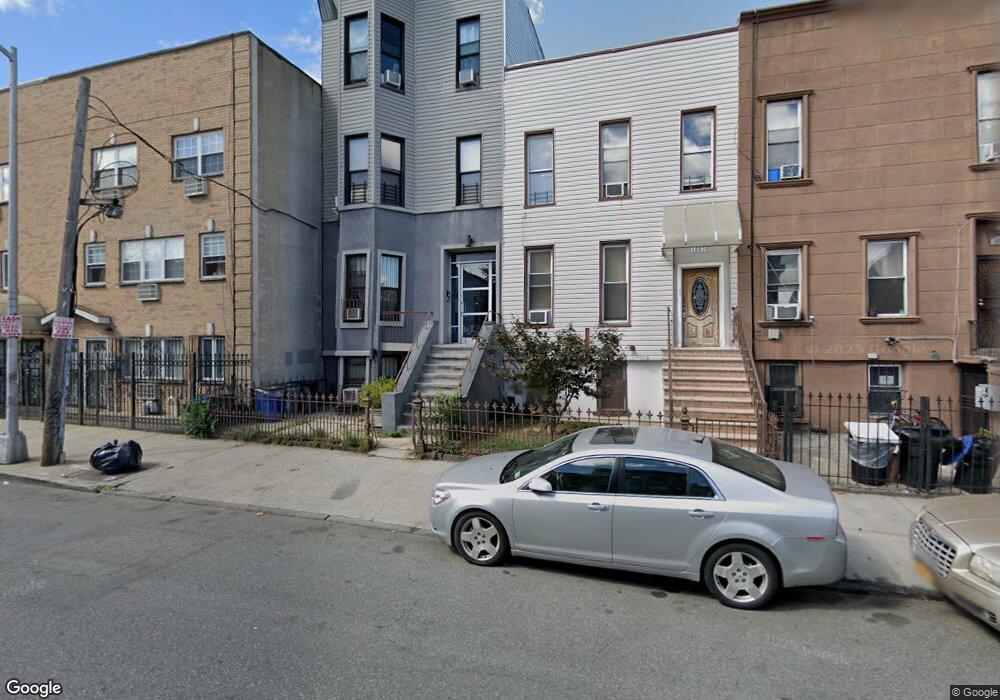
1035 Halsey St Unit 1 Brooklyn, NY 11207
Bushwick NeighborhoodEstimated Value: $1,556,000 - $2,154,000
2
Beds
1
Bath
1,000
Sq Ft
$1,756/Sq Ft
Est. Value
About This Home
This home is located at 1035 Halsey St Unit 1, Brooklyn, NY 11207 and is currently estimated at $1,756,000, approximately $1,756 per square foot. 1035 Halsey St Unit 1 is a home located in Kings County with nearby schools including P.S./I.S. 045 Horace E. Greene, Evergreen Middle School for Urban Exploration, and Achievement First Bushwick Charter School.
Ownership History
Date
Name
Owned For
Owner Type
Purchase Details
Closed on
Dec 17, 2018
Sold by
Deleon-Sanchez Suhana and Sanchez Sidronio
Bought by
1035 Halsey Llc
Current Estimated Value
Purchase Details
Closed on
May 30, 2012
Sold by
Deleon Antoinette
Bought by
Deleon-Sanchez Suhana and As Joint Tenant With Right Of Survivorsh
Home Financials for this Owner
Home Financials are based on the most recent Mortgage that was taken out on this home.
Original Mortgage
$83,562
Interest Rate
3.85%
Mortgage Type
New Conventional
Purchase Details
Closed on
Jan 22, 2010
Sold by
Smith Samella
Bought by
Deleon Antoinette and Deleon-Sanchez Suhana
Home Financials for this Owner
Home Financials are based on the most recent Mortgage that was taken out on this home.
Original Mortgage
$296,250
Interest Rate
5.05%
Mortgage Type
Purchase Money Mortgage
Create a Home Valuation Report for This Property
The Home Valuation Report is an in-depth analysis detailing your home's value as well as a comparison with similar homes in the area
Home Values in the Area
Average Home Value in this Area
Purchase History
| Date | Buyer | Sale Price | Title Company |
|---|---|---|---|
| 1035 Halsey Llc | -- | -- | |
| Deleon-Sanchez Suhana | -- | -- | |
| Deleon Antoinette | $395,000 | -- |
Source: Public Records
Mortgage History
| Date | Status | Borrower | Loan Amount |
|---|---|---|---|
| Previous Owner | Deleon-Sanchez Suhana | $83,562 | |
| Previous Owner | Deleon Antoinette | $296,250 |
Source: Public Records
Tax History Compared to Growth
Tax History
| Year | Tax Paid | Tax Assessment Tax Assessment Total Assessment is a certain percentage of the fair market value that is determined by local assessors to be the total taxable value of land and additions on the property. | Land | Improvement |
|---|---|---|---|---|
| 2025 | $4,830 | $118,380 | $9,120 | $109,260 |
| 2024 | $4,830 | $110,820 | $9,120 | $101,700 |
| 2023 | $4,608 | $119,100 | $9,120 | $109,980 |
| 2022 | $4,530 | $114,060 | $9,120 | $104,940 |
| 2021 | $4,739 | $88,080 | $9,120 | $78,960 |
| 2020 | $2,223 | $76,140 | $9,120 | $67,020 |
| 2019 | $4,193 | $76,140 | $9,120 | $67,020 |
| 2018 | $3,855 | $18,909 | $2,664 | $16,245 |
| 2017 | $3,855 | $18,909 | $2,969 | $15,940 |
| 2016 | $3,751 | $18,766 | $3,592 | $15,174 |
| 2015 | $1,932 | $17,704 | $3,779 | $13,925 |
| 2014 | $1,932 | $16,702 | $4,276 | $12,426 |
Source: Public Records
Map
Nearby Homes
- 81 Weirfield St
- 1050 Hancock St Unit 3E
- 89 Weirfield St
- 1090 Hancock St
- 1085 Hancock St
- 1255 Bushwick Ave Unit 5C
- 1255 Bushwick Ave Unit 7B
- 1255 Bushwick Ave Unit 1B
- 1152 Jefferson Ave
- 1111 Jefferson Ave
- 1043 Halsey St Unit 1
- 1133 Jefferson Ave
- 1019 Hancock St Unit 3B
- 1019 Hancock St Unit TWNHSE
- 1019 Hancock St Unit 3A
- 1019 Hancock St Unit 4B
- 1019 Hancock St Unit 2 A
- 1019 Hancock St Unit 1A
- 1019 Hancock St Unit 4A
- 80 Cornelia St Unit 3
- 1035 Halsey St
- 1037 Halsey St
- 1031 Halsey St
- 1031 Halsey St Unit 1
- 1039 Halsey St
- 1263 Bushwick Ave
- 1263 Bushwick Ave Unit A
- 1029 Halsey St
- 1029 Halsey St Unit 2
- 1041 Halsey St
- 1261 Bushwick Ave Unit 2
- 1261 Bushwick Ave
- 1261 Bushwick Ave Unit 3
- 1259 Bushwick Ave
- 1259 Bushwick Ave Unit 3
- 1259 Bushwick Ave Unit 2
- 1259 Bushwick Ave Unit 1
- 1027 Halsey St Unit 3
- 1027 Halsey St
- 1043 Halsey St Unit 4