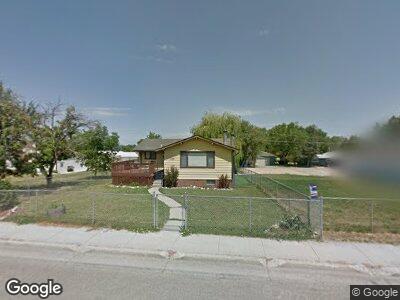
1035 W 5th St Sheridan, WY 82801
Estimated Value: $75,000 - $394,783
3
Beds
2
Baths
1,018
Sq Ft
$295/Sq Ft
Est. Value
About This Home
This home is located at 1035 W 5th St, Sheridan, WY 82801 and is currently estimated at $300,696, approximately $295 per square foot. 1035 W 5th St is a home with nearby schools including Sheridan High School and Martin Luther Grammar School.
Ownership History
Date
Name
Owned For
Owner Type
Purchase Details
Closed on
Sep 30, 2022
Sold by
Mccrary Eva
Bought by
Mcvay Chance and Mcvay Shelly
Current Estimated Value
Home Financials for this Owner
Home Financials are based on the most recent Mortgage that was taken out on this home.
Original Mortgage
$317,000
Outstanding Balance
$306,979
Interest Rate
4.75%
Mortgage Type
New Conventional
Purchase Details
Closed on
Jul 31, 2012
Sold by
Tanner Joseph D and Nimick Mary B
Bought by
Mccrary Eva
Home Financials for this Owner
Home Financials are based on the most recent Mortgage that was taken out on this home.
Original Mortgage
$188,775
Interest Rate
3.63%
Mortgage Type
New Conventional
Purchase Details
Closed on
Mar 29, 2007
Sold by
Athey Jesse M and Athey Pamela M
Bought by
Tanner Joseph D and Nimick Mary B
Home Financials for this Owner
Home Financials are based on the most recent Mortgage that was taken out on this home.
Original Mortgage
$156,000
Interest Rate
6.19%
Mortgage Type
New Conventional
Create a Home Valuation Report for This Property
The Home Valuation Report is an in-depth analysis detailing your home's value as well as a comparison with similar homes in the area
Home Values in the Area
Average Home Value in this Area
Purchase History
| Date | Buyer | Sale Price | Title Company |
|---|---|---|---|
| Mcvay Chance | -- | -- | |
| Mccrary Eva | -- | None Available | |
| Tanner Joseph D | -- | None Available |
Source: Public Records
Mortgage History
| Date | Status | Borrower | Loan Amount |
|---|---|---|---|
| Open | Mcvay Chance Tory | $39,705 | |
| Open | Mcvay Chance | $317,000 | |
| Previous Owner | Mccrary Eva | $188,775 | |
| Previous Owner | Tanner Joseph D | $158,400 | |
| Previous Owner | Tanner Joseph D | $156,000 |
Source: Public Records
Tax History Compared to Growth
Tax History
| Year | Tax Paid | Tax Assessment Tax Assessment Total Assessment is a certain percentage of the fair market value that is determined by local assessors to be the total taxable value of land and additions on the property. | Land | Improvement |
|---|---|---|---|---|
| 2024 | $2,362 | $33,036 | $6,147 | $26,889 |
| 2023 | $2,264 | $31,664 | $5,235 | $26,429 |
| 2022 | $1,956 | $27,351 | $4,668 | $22,683 |
| 2021 | $1,685 | $23,560 | $5,115 | $18,445 |
| 2020 | $1,593 | $22,282 | $4,714 | $17,568 |
| 2019 | $1,556 | $21,757 | $4,714 | $17,043 |
| 2018 | $1,464 | $20,469 | $4,653 | $15,816 |
| 2017 | $1,393 | $19,477 | $4,344 | $15,133 |
| 2015 | $1,367 | $19,122 | $3,969 | $15,153 |
| 2014 | $1,346 | $18,830 | $3,846 | $14,984 |
| 2013 | -- | $18,520 | $3,343 | $15,177 |
Source: Public Records
Map
Nearby Homes
- 937 Florence Ave
- 918 Highland Ave Unit A
- 803 W 5th St
- 835 Avon St
- 1140 Park Dr
- 1300 Burton St Unit D
- 1345 Avon St
- 848 Bellevue Ave
- 1324 Lewis St
- 1386 Cove Ct
- 1433 Lewis St
- 509 Highland Ave
- 1467 Lewis St
- 1465 Highland Ave
- 460 W 5th St
- 1381 Dana Ave
- 1603 Taylor Ave
- 1645 Taylor Ave
- 1651 Taylor Ave
- 1663 Taylor Ave
- 1035 W 5th St
- 1015 W 5th St
- 1055 W 5th St
- 1005 W 5th St
- 1044 Dunnuck St
- 1030 Florence Ave
- 1044 W 5th St
- 1006 W 5th St
- 1048 Florence Ave
- 953 W 5th St
- 969 Greystone Ave
- 1054 Florence Ave
- 958 W 5th St
- 1037 Florence Ave
- 951 W 5th St
- 951 W 5th St Unit 951 1/2
- 1027 Burton St
- 1055 Burton St
- 1053 Florence Ave
- 944 W 5th St