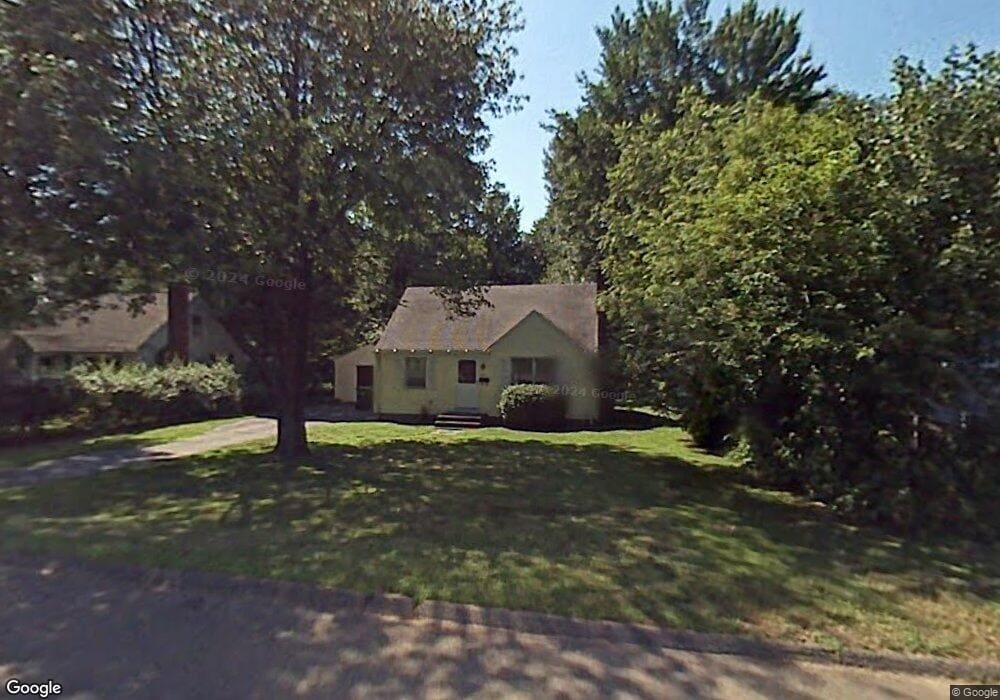
1035 Worthy St Windsor, CT 06095
Estimated Value: $279,000 - $297,000
3
Beds
1
Bath
1,085
Sq Ft
$265/Sq Ft
Est. Value
About This Home
This home is located at 1035 Worthy St, Windsor, CT 06095 and is currently estimated at $287,721, approximately $265 per square foot. 1035 Worthy St is a home located in Hartford County with nearby schools including Poquonock Elementary School, Clover Street School, and Sage Park Middle School.
Ownership History
Date
Name
Owned For
Owner Type
Purchase Details
Closed on
Nov 11, 2025
Sold by
Baker Jacqueline S and Baker Terrence
Bought by
Baker Jacqueline S
Current Estimated Value
Purchase Details
Closed on
Nov 23, 2021
Sold by
Camacho Hilda
Bought by
Soto Jacqueline and Baker Terrence
Home Financials for this Owner
Home Financials are based on the most recent Mortgage that was taken out on this home.
Original Mortgage
$142,000
Interest Rate
3.05%
Mortgage Type
Purchase Money Mortgage
Purchase Details
Closed on
May 21, 2010
Sold by
Scheidel Michael and Scheidel Shirley
Bought by
Soto Hilda
Home Financials for this Owner
Home Financials are based on the most recent Mortgage that was taken out on this home.
Original Mortgage
$147,150
Interest Rate
4.5%
Mortgage Type
FHA
Create a Home Valuation Report for This Property
The Home Valuation Report is an in-depth analysis detailing your home's value as well as a comparison with similar homes in the area
Home Values in the Area
Average Home Value in this Area
Purchase History
| Date | Buyer | Sale Price | Title Company |
|---|---|---|---|
| Baker Jacqueline S | $5,000 | -- | |
| Soto Jacqueline | $177,500 | None Available | |
| Soto Hilda | $149,900 | -- |
Source: Public Records
Mortgage History
| Date | Status | Borrower | Loan Amount |
|---|---|---|---|
| Previous Owner | Soto Jacqueline | $142,000 | |
| Previous Owner | Soto Hilda | $147,150 |
Source: Public Records
Tax History
| Year | Tax Paid | Tax Assessment Tax Assessment Total Assessment is a certain percentage of the fair market value that is determined by local assessors to be the total taxable value of land and additions on the property. | Land | Improvement |
|---|---|---|---|---|
| 2025 | $4,895 | $172,060 | $55,300 | $116,760 |
| 2024 | $5,217 | $172,060 | $55,300 | $116,760 |
| 2023 | $3,547 | $105,560 | $43,400 | $62,160 |
| 2022 | $3,512 | $105,560 | $43,400 | $62,160 |
| 2021 | $3,512 | $105,560 | $43,400 | $62,160 |
| 2020 | $3,495 | $105,560 | $43,400 | $62,160 |
| 2019 | $3,418 | $105,560 | $43,400 | $62,160 |
| 2018 | $3,405 | $103,320 | $43,400 | $59,920 |
| 2017 | $3,353 | $103,320 | $43,400 | $59,920 |
| 2016 | $3,257 | $103,320 | $43,400 | $59,920 |
| 2015 | $3,195 | $103,320 | $43,400 | $59,920 |
| 2014 | $3,148 | $103,320 | $43,400 | $59,920 |
Source: Public Records
Map
Nearby Homes
Your Personal Tour Guide
Ask me questions while you tour the home.