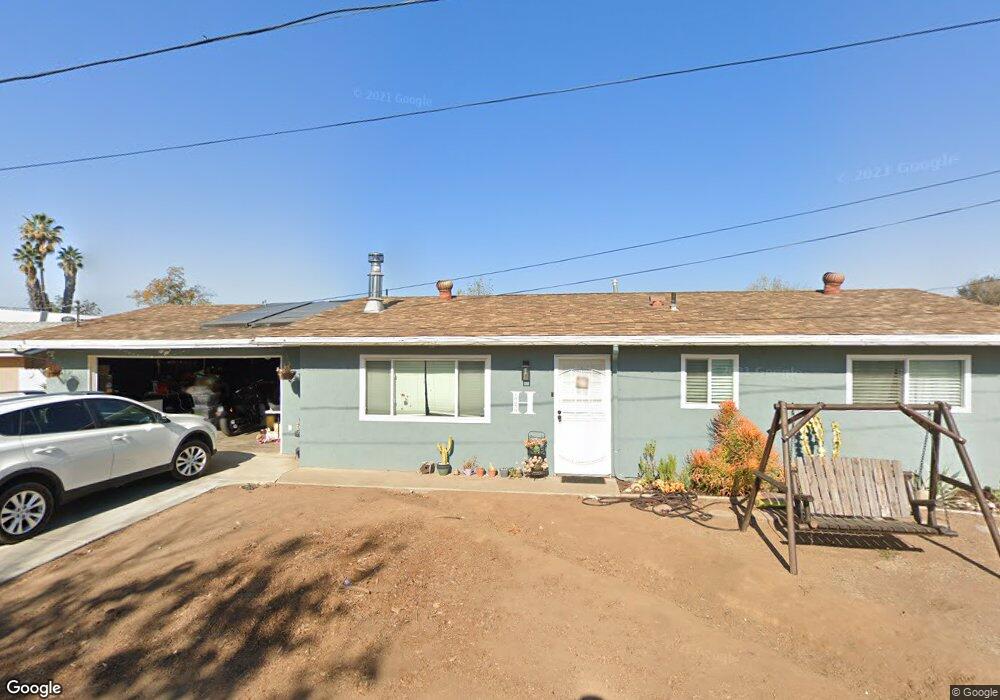
10350 El Toro Ln Santee, CA 92071
Estimated Value: $765,758 - $879,000
3
Beds
2
Baths
1,134
Sq Ft
$702/Sq Ft
Est. Value
About This Home
This home is located at 10350 El Toro Ln, Santee, CA 92071 and is currently estimated at $796,440, approximately $702 per square foot. 10350 El Toro Ln is a home located in San Diego County with nearby schools including Pride Academy At Prospect Avenue and West Hills High School.
Ownership History
Date
Name
Owned For
Owner Type
Purchase Details
Closed on
Aug 23, 2018
Sold by
Kennel Cynthia M
Bought by
Harwood Andrew James and Harwood Danielle L
Current Estimated Value
Home Financials for this Owner
Home Financials are based on the most recent Mortgage that was taken out on this home.
Original Mortgage
$453,000
Outstanding Balance
$393,412
Interest Rate
4.5%
Mortgage Type
VA
Estimated Equity
$403,028
Purchase Details
Closed on
Jan 15, 2014
Sold by
Kennel Jack G and Kennel Cynthia M
Bought by
The Kennel Family Trust
Purchase Details
Closed on
Aug 31, 2000
Sold by
Kennel Jack G
Bought by
Kennel Jack G and Kennel Cynthia M
Purchase Details
Closed on
Aug 27, 1993
Sold by
Kennel Lucinda C
Bought by
Kennel Jack G
Home Financials for this Owner
Home Financials are based on the most recent Mortgage that was taken out on this home.
Original Mortgage
$91,000
Interest Rate
7.2%
Create a Home Valuation Report for This Property
The Home Valuation Report is an in-depth analysis detailing your home's value as well as a comparison with similar homes in the area
Home Values in the Area
Average Home Value in this Area
Purchase History
| Date | Buyer | Sale Price | Title Company |
|---|---|---|---|
| Harwood Andrew James | $453,000 | California Title Company | |
| The Kennel Family Trust | -- | None Available | |
| Kennel Jack G | -- | -- | |
| Kennel Jack G | $56,000 | Orange Coast Title |
Source: Public Records
Mortgage History
| Date | Status | Borrower | Loan Amount |
|---|---|---|---|
| Open | Harwood Andrew James | $453,000 | |
| Previous Owner | Kennel Jack G | $91,000 |
Source: Public Records
Tax History Compared to Growth
Tax History
| Year | Tax Paid | Tax Assessment Tax Assessment Total Assessment is a certain percentage of the fair market value that is determined by local assessors to be the total taxable value of land and additions on the property. | Land | Improvement |
|---|---|---|---|---|
| 2025 | $6,017 | $505,322 | $127,178 | $378,144 |
| 2024 | $6,017 | $495,415 | $124,685 | $370,730 |
| 2023 | $5,833 | $485,702 | $122,241 | $363,461 |
| 2022 | $5,791 | $476,180 | $119,845 | $356,335 |
| 2021 | $5,713 | $466,845 | $117,496 | $349,349 |
| 2020 | $5,642 | $462,059 | $116,292 | $345,767 |
| 2019 | $5,444 | $453,000 | $114,012 | $338,988 |
| 2018 | $993 | $79,763 | $20,075 | $59,688 |
| 2017 | $978 | $78,200 | $19,682 | $58,518 |
| 2016 | $947 | $76,668 | $19,297 | $57,371 |
| 2015 | $934 | $75,518 | $19,008 | $56,510 |
| 2014 | -- | $74,040 | $18,636 | $55,404 |
Source: Public Records
Map
Nearby Homes
- 8749 Cottonwood Ave
- 8756 Cottonwood Ave
- 10225 Daybreak Ln Unit 5
- 10236 Brightwood Ln Unit 1
- 10214 Daybreak Ln Unit 6
- 8806 Appleblossom Ct Unit 4
- 10210 Brightwood Ln Unit 2
- 8796 Aspenglow Place Unit 2
- 8712 N Magnolia Ave Unit 169
- 8712 N Magnolia Ave Unit 15
- 8712 N Magnolia Ave Unit 289
- 8712 N Magnolia Ave Unit 65
- 8737 Rhodes Ct
- 10727 Holly Meadows Dr Unit A
- 9861 Mission Greens Ct Unit 1
- 9848 Buena Vista Ave Unit 3
- 10791 Jeanne Terrace Unit A
- 10775 Tamar Terrace Unit A
- 10794 Jeanne Terrace Unit D
- 9857 Mission Gorge Rd Unit 4
- 10346 El Toro Ln
- 10362 El Toro Ln
- 10353 El Toro Ln
- 10359 El Toro Ln
- 10345 El Toro Ln
- 10353 Buena Vista Ave
- 10359 Buena Vista Ave
- 8728 Railroad Ave
- 10333 El Matador Ln
- 8716 Railroad Ave
- 10359 Ricky Ln
- 8738 Railroad Ave
- 10345 Buena Vista Ave
- 0 Railroad Ave Unit 39 250018980
- 0 Railroad Ave Unit 1 240009109
- 0 Railroad Ave Unit PTP2200954
- 0 Railroad Ave Unit 1
- 10337 Buena Vista Ave
- 10331 Buena Vista Ave
- 10327 El Matador Ln