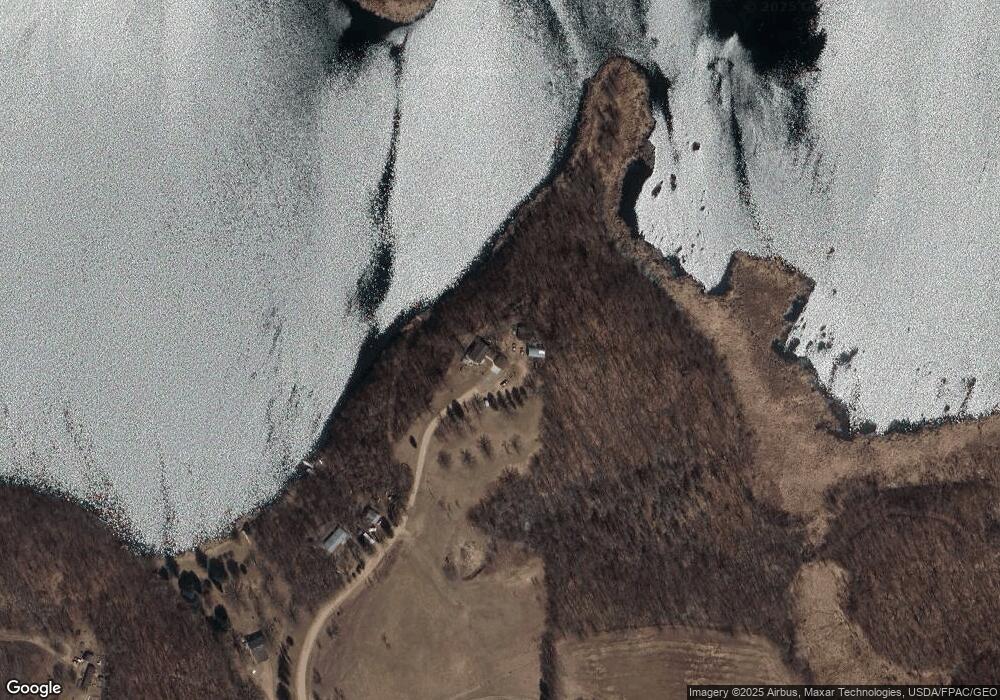
10350 S Mill Pond Ln Detroit Lakes, MN 56501
Estimated Value: $433,000 - $904,000
4
Beds
3
Baths
3,400
Sq Ft
$182/Sq Ft
Est. Value
About This Home
This home is located at 10350 S Mill Pond Ln, Detroit Lakes, MN 56501 and is currently estimated at $617,537, approximately $181 per square foot. 10350 S Mill Pond Ln is a home located in Becker County with nearby schools including Detroit Lakes Senior High School.
Ownership History
Date
Name
Owned For
Owner Type
Purchase Details
Closed on
Jan 24, 2019
Sold by
Hilgers Robert F and Hilgers Cynthia D
Bought by
Zick Michael and Zick Lorinda
Current Estimated Value
Home Financials for this Owner
Home Financials are based on the most recent Mortgage that was taken out on this home.
Original Mortgage
$264,000
Outstanding Balance
$231,636
Interest Rate
4.5%
Mortgage Type
New Conventional
Estimated Equity
$385,901
Purchase Details
Closed on
Oct 7, 2016
Sold by
Hilgers Robert Frank and Hilgers Cynthia Delores
Bought by
Zick Michael and Zick Lorinda
Purchase Details
Closed on
Apr 8, 2010
Sold by
Federal Home Loan Mortgage Corporation
Bought by
Hilgers Robert Frank and Hilgers Cynthia Delores
Purchase Details
Closed on
Oct 30, 2009
Sold by
Countrywide Home Loans Inc
Bought by
Federal Home Loan Mortgage Corporation
Create a Home Valuation Report for This Property
The Home Valuation Report is an in-depth analysis detailing your home's value as well as a comparison with similar homes in the area
Home Values in the Area
Average Home Value in this Area
Purchase History
| Date | Buyer | Sale Price | Title Company |
|---|---|---|---|
| Zick Michael | $280,000 | -- | |
| Zick Michael | -- | Attorney | |
| Hilgers Robert Frank | $195,000 | None Available | |
| Federal Home Loan Mortgage Corporation | -- | None Available |
Source: Public Records
Mortgage History
| Date | Status | Borrower | Loan Amount |
|---|---|---|---|
| Open | Zick Michael | $264,000 |
Source: Public Records
Tax History Compared to Growth
Tax History
| Year | Tax Paid | Tax Assessment Tax Assessment Total Assessment is a certain percentage of the fair market value that is determined by local assessors to be the total taxable value of land and additions on the property. | Land | Improvement |
|---|---|---|---|---|
| 2025 | $2,972 | $479,400 | $138,100 | $341,300 |
| 2024 | $2,866 | $442,300 | $136,700 | $305,600 |
| 2023 | $2,980 | $420,500 | $134,900 | $285,600 |
| 2022 | $2,998 | $382,100 | $131,900 | $250,200 |
| 2021 | $2,864 | $351,000 | $131,900 | $219,100 |
| 2020 | $2,902 | $351,000 | $131,900 | $219,100 |
| 2019 | $2,922 | $349,600 | $123,800 | $225,800 |
| 2018 | $2,592 | $344,400 | $123,800 | $220,600 |
| 2017 | $2,418 | $355,600 | $118,800 | $236,800 |
| 2016 | $2,336 | $317,600 | $120,300 | $197,300 |
| 2015 | $2,218 | $296,900 | $118,100 | $178,800 |
| 2014 | -- | $291,200 | $118,100 | $173,100 |
Source: Public Records
Map
Nearby Homes
- 24594 S Melissa Dr
- 23271 Roosevelt Beach Ln
- 23093 Roosevelt Beach Ln
- 29074 Tee Lake Rd
- 12xxx County Highway 17
- 11486 Ravenswood Beach Rd
- 11494 Ravenswood Beach Rd
- 12104 County Highway 17
- 51418 County Highway 31
- 28387 Candor Hall Rd
- TBD Ottoson Rd
- 51021 #8 Fish Lake Rd
- 50943 Fish Lake Rd
- Tbd 485th St
- TBD 130th St
- 10100 Maple Ln
- 14196 E Fox Lake Rd
- 21335 Halstad Lake Rd
- 12615 S Abbey Lake Ln
- 14473 Barnes Dr
- 10370 S Mill Pond Ln
- 10310 S Mill Pond Ln
- 10252 S Mill Pond Ln
- 10237 S Mill Pond Ln
- 10240 S Mill Pond Ln
- 10220 S Mill Pond Ln
- 23638 Millview Ln
- 24015 Mill Pond Dr
- 0 Tbd 21 Sandy Beach Dr Unit 6208421
- 0 Tbd 21 Sandy Beach Dr Unit 20-32806
- Tbd 20 Sandy Beach Dr
- 0 Tbd 20 Sandy Beach Dr Unit 20-32805
- 0 Tbd 22 Sandy Beach Dr Dr Unit 21-869
- 23634 Millview Ln
- Tbd 22 Sandy Beach Dr
- 0 Tbd 22 Sandy Beach Dr Unit 20-32807
- 0 Tbd 22 Sandy Beach Dr
- 23828 Mill Pond Dr
- 10079 S Mill Pond Ln
- 0 Tbd 20 Sandy Beach Dr Dr Unit 21-870