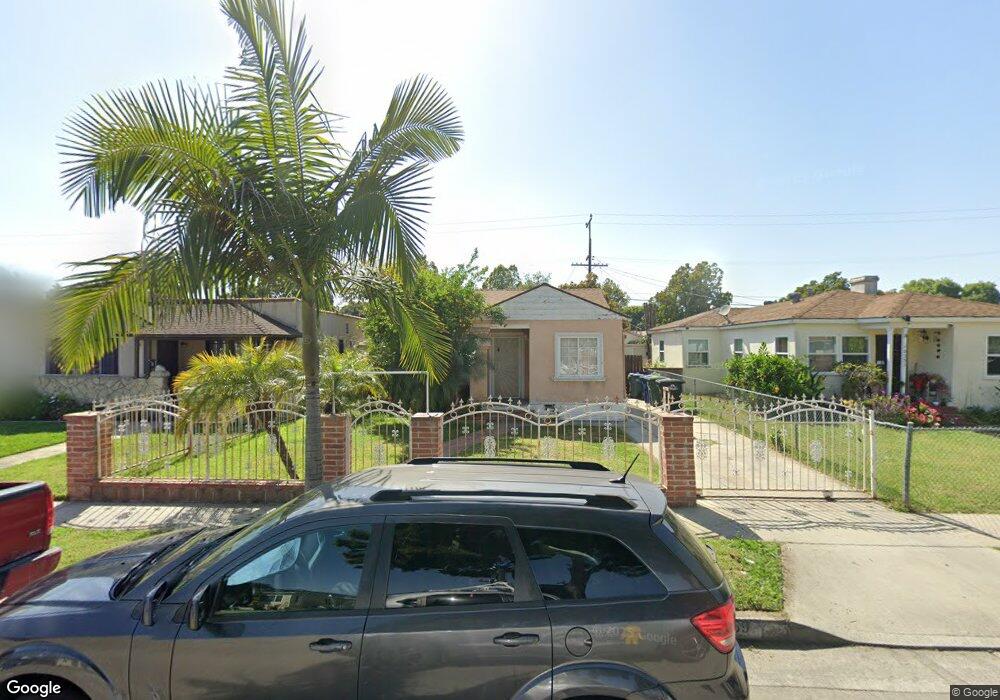
10359 Pescadero Ave South Gate, CA 90280
Estimated Value: $599,000 - $646,000
2
Beds
1
Bath
860
Sq Ft
$714/Sq Ft
Est. Value
About This Home
This home is located at 10359 Pescadero Ave, South Gate, CA 90280 and is currently estimated at $614,396, approximately $714 per square foot. 10359 Pescadero Ave is a home located in Los Angeles County with nearby schools including Montara Avenue Elementary School, Southeast Middle School, and South Gate Middle School.
Ownership History
Date
Name
Owned For
Owner Type
Purchase Details
Closed on
Apr 4, 2012
Sold by
Kaitz Alan
Bought by
Kaitz Alan B and Kaitz Sharon L
Current Estimated Value
Purchase Details
Closed on
Sep 17, 2009
Sold by
Valencia Jose P
Bought by
All American Technologies Inc
Purchase Details
Closed on
Oct 12, 1998
Sold by
Isador Bernardo
Bought by
Valencia Jose P and Valencia Noemy
Home Financials for this Owner
Home Financials are based on the most recent Mortgage that was taken out on this home.
Original Mortgage
$139,673
Interest Rate
6.42%
Mortgage Type
FHA
Purchase Details
Closed on
Aug 2, 1994
Sold by
American Svgs Bank Fa
Bought by
Valencia Jose P and Valencia Noemy
Home Financials for this Owner
Home Financials are based on the most recent Mortgage that was taken out on this home.
Original Mortgage
$133,000
Interest Rate
8.55%
Purchase Details
Closed on
Sep 13, 1993
Sold by
N A Mtg Services Inc
Bought by
American Svgs Bank Fa
Create a Home Valuation Report for This Property
The Home Valuation Report is an in-depth analysis detailing your home's value as well as a comparison with similar homes in the area
Home Values in the Area
Average Home Value in this Area
Purchase History
| Date | Buyer | Sale Price | Title Company |
|---|---|---|---|
| Kaitz Alan B | -- | None Available | |
| All American Technologies Inc | $5,000 | None Available | |
| Valencia Jose P | -- | South Coast Title | |
| Valencia Jose P | $140,000 | Stewart Title | |
| American Svgs Bank Fa | $120,260 | Stewart Title |
Source: Public Records
Mortgage History
| Date | Status | Borrower | Loan Amount |
|---|---|---|---|
| Previous Owner | Valencia Jose P | $139,673 | |
| Previous Owner | Valencia Jose P | $133,000 |
Source: Public Records
Tax History Compared to Growth
Tax History
| Year | Tax Paid | Tax Assessment Tax Assessment Total Assessment is a certain percentage of the fair market value that is determined by local assessors to be the total taxable value of land and additions on the property. | Land | Improvement |
|---|---|---|---|---|
| 2025 | $3,567 | $258,149 | $193,616 | $64,533 |
| 2024 | $3,567 | $253,088 | $189,820 | $63,268 |
| 2023 | $3,508 | $248,127 | $186,099 | $62,028 |
| 2022 | $3,347 | $243,262 | $182,450 | $60,812 |
| 2021 | $3,307 | $238,493 | $178,873 | $59,620 |
| 2019 | $3,205 | $231,420 | $173,568 | $57,852 |
| 2018 | $3,120 | $226,883 | $170,165 | $56,718 |
| 2016 | $2,981 | $218,074 | $163,558 | $54,516 |
| 2015 | $2,934 | $214,800 | $161,102 | $53,698 |
| 2014 | $2,936 | $210,594 | $157,947 | $52,647 |
Source: Public Records
Map
Nearby Homes
- 10333 Capistrano Ave
- 10430 San Jose Ave
- 10303 Long Beach Blvd
- 10355 Long Beach Blvd
- 3220 Tecumseh Ave
- 3034 Nebraska Ave
- 2714 E 109th St
- 2649 111th St
- 2732 Indiana Ave
- 2914 Missouri Ave
- 2927 Missouri Ave
- 2600 Nebraska Ave
- 9616 Long Beach Blvd
- 9612 Long Beach Blvd
- 3130 Kansas Ave
- 10245 Virginia Ave
- 3171 Norton Ave
- 2905 Kansas Ave
- 10719 Mona Blvd
- 11141 Franklin St
- 10401 Pescadero Ave
- 10353 Pescadero Ave
- 10347 Pescadero Ave
- 10409 Pescadero Ave
- 10358 Montara Ave
- 10400 Montara Ave
- 10352 Montara Ave
- 10415 Pescadero Ave
- 10341 Pescadero Ave
- 10408 Montara Ave
- 10346 Montara Ave
- 10333 Pescadero Ave
- 10421 Pescadero Ave
- 10358 Pescadero Ave
- 10414 Montara Ave
- 10340 Montara Ave
- 10352 Pescadero Ave
- 10400 Pescadero Ave
- 10346 Pescadero Ave
- 10408 Pescadero Ave