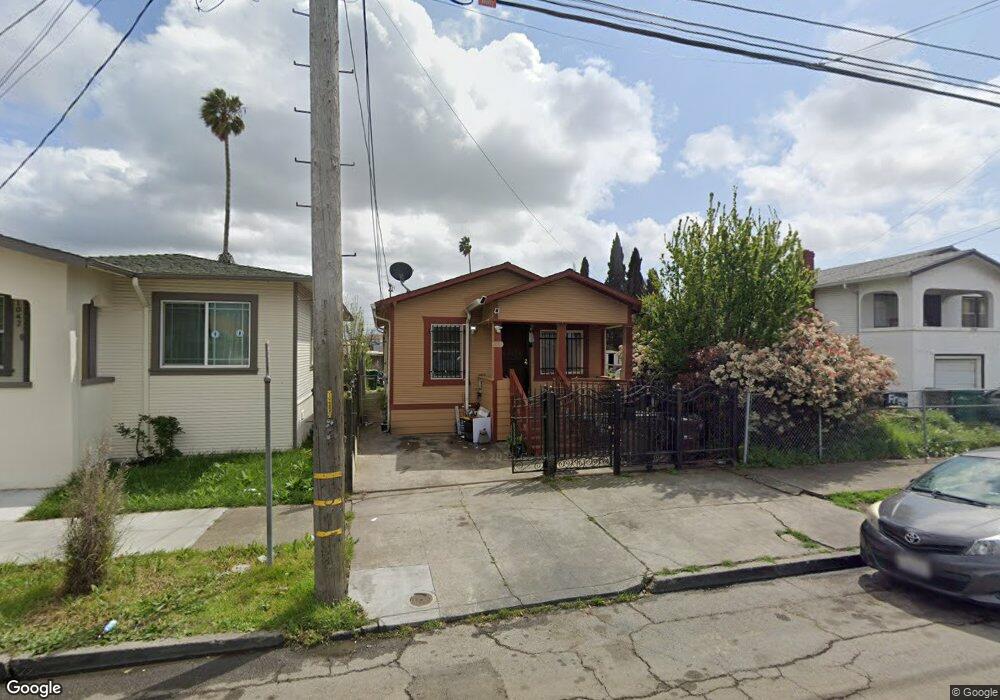
1036 88th Ave Oakland, CA 94621
Highland NeighborhoodEstimated Value: $358,000 - $410,000
2
Beds
1
Bath
896
Sq Ft
$428/Sq Ft
Est. Value
About This Home
This home is located at 1036 88th Ave, Oakland, CA 94621 and is currently estimated at $383,622, approximately $428 per square foot. 1036 88th Ave is a home located in Alameda County with nearby schools including New Highland Academy, Acorn Woodland Elementary School, and Encompass Academy Elementary.
Ownership History
Date
Name
Owned For
Owner Type
Purchase Details
Closed on
Dec 16, 1999
Sold by
Rodriguez Olivia A and Sorbi Linda A
Bought by
Magana Rigoberto and Ramos Rafael
Current Estimated Value
Home Financials for this Owner
Home Financials are based on the most recent Mortgage that was taken out on this home.
Original Mortgage
$99,750
Outstanding Balance
$30,826
Interest Rate
7.69%
Estimated Equity
$352,796
Create a Home Valuation Report for This Property
The Home Valuation Report is an in-depth analysis detailing your home's value as well as a comparison with similar homes in the area
Home Values in the Area
Average Home Value in this Area
Purchase History
| Date | Buyer | Sale Price | Title Company |
|---|---|---|---|
| Magana Rigoberto | $105,000 | Financial Title Company |
Source: Public Records
Mortgage History
| Date | Status | Borrower | Loan Amount |
|---|---|---|---|
| Open | Magana Rigoberto | $99,750 |
Source: Public Records
Tax History Compared to Growth
Tax History
| Year | Tax Paid | Tax Assessment Tax Assessment Total Assessment is a certain percentage of the fair market value that is determined by local assessors to be the total taxable value of land and additions on the property. | Land | Improvement |
|---|---|---|---|---|
| 2025 | $3,842 | $161,373 | $48,412 | $112,961 |
| 2024 | $3,842 | $158,208 | $47,462 | $110,746 |
| 2023 | $3,926 | $155,107 | $46,532 | $108,575 |
| 2022 | $3,762 | $152,067 | $45,620 | $106,447 |
| 2021 | $3,465 | $149,085 | $44,725 | $104,360 |
| 2020 | $3,425 | $147,558 | $44,267 | $103,291 |
| 2019 | $3,213 | $144,665 | $43,399 | $101,266 |
| 2018 | $3,150 | $141,828 | $42,548 | $99,280 |
| 2017 | $3,000 | $139,048 | $41,714 | $97,334 |
| 2016 | $2,822 | $136,323 | $40,897 | $95,426 |
| 2015 | $2,803 | $134,275 | $40,282 | $93,993 |
| 2014 | $2,738 | $131,645 | $39,493 | $92,152 |
Source: Public Records
Map
Nearby Homes