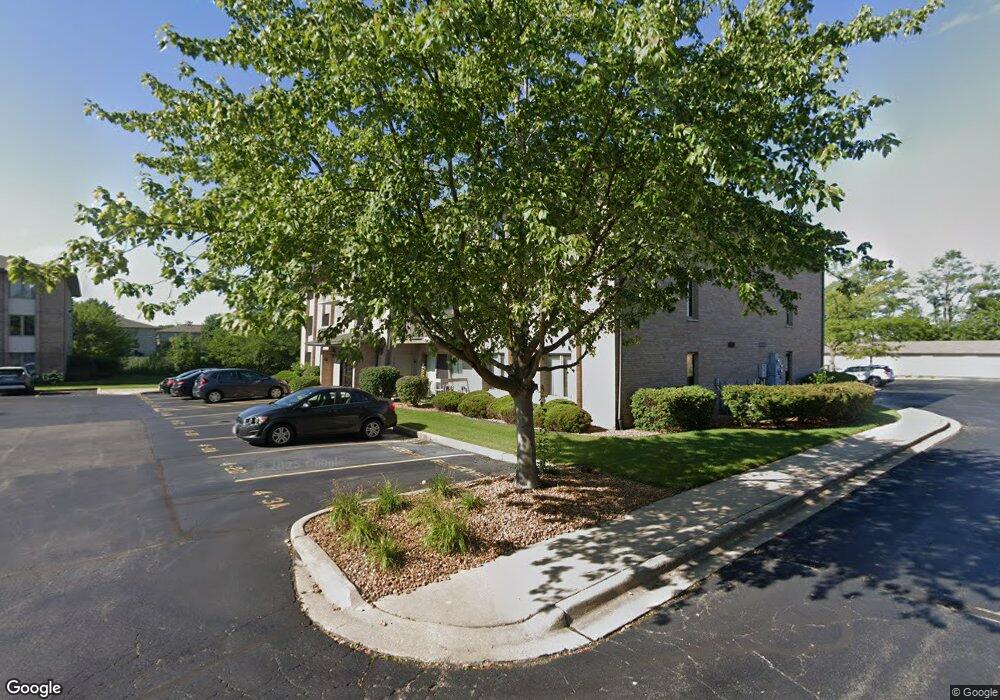
1036 Ashley Ct N Unit N3B Lockport, IL 60441
Estimated Value: $206,386 - $238,000
--
Bed
2
Baths
--
Sq Ft
0.38
Acres
About This Home
This home is located at 1036 Ashley Ct N Unit N3B, Lockport, IL 60441 and is currently estimated at $226,097. 1036 Ashley Ct N Unit N3B is a home located in Will County with nearby schools including Milne Grove Elementary School, Kelvin Grove Jr High School, and Lockport Township High School East.
Ownership History
Date
Name
Owned For
Owner Type
Purchase Details
Closed on
Jul 29, 2024
Sold by
Partikas Rytis and Partikas Laura
Bought by
Rytis Partikas Trust and Laura Partikas Trust
Current Estimated Value
Purchase Details
Closed on
Mar 5, 2021
Sold by
Jimenez Derrick and Jimenez Danielle M
Bought by
Partikeas Rytis and Partikeas Laura
Purchase Details
Closed on
Mar 18, 2018
Sold by
Rohrback Dawn and Rohrback Heather A
Bought by
Jimenez Derrick and Jimenez Danielle M
Home Financials for this Owner
Home Financials are based on the most recent Mortgage that was taken out on this home.
Original Mortgage
$125,130
Interest Rate
4.99%
Mortgage Type
New Conventional
Purchase Details
Closed on
Jul 1, 1996
Sold by
Heritage Trust Company
Bought by
Rohrback Mary Ann
Home Financials for this Owner
Home Financials are based on the most recent Mortgage that was taken out on this home.
Original Mortgage
$92,400
Interest Rate
8.31%
Mortgage Type
Purchase Money Mortgage
Create a Home Valuation Report for This Property
The Home Valuation Report is an in-depth analysis detailing your home's value as well as a comparison with similar homes in the area
Home Values in the Area
Average Home Value in this Area
Purchase History
| Date | Buyer | Sale Price | Title Company |
|---|---|---|---|
| Rytis Partikas Trust | -- | None Listed On Document | |
| Partikeas Rytis | $159,000 | Old Republic Title | |
| Jimenez Derrick | $129,000 | Stewart Title | |
| Rohrback Mary Ann | $94,000 | -- |
Source: Public Records
Mortgage History
| Date | Status | Borrower | Loan Amount |
|---|---|---|---|
| Previous Owner | Jimenez Derrick | $125,130 | |
| Previous Owner | Rohrback Mary Ann | $92,400 |
Source: Public Records
Tax History Compared to Growth
Tax History
| Year | Tax Paid | Tax Assessment Tax Assessment Total Assessment is a certain percentage of the fair market value that is determined by local assessors to be the total taxable value of land and additions on the property. | Land | Improvement |
|---|---|---|---|---|
| 2024 | $4,548 | $52,975 | $9,131 | $43,844 |
| 2023 | $4,548 | $47,558 | $8,197 | $39,361 |
| 2022 | $4,044 | $43,924 | $7,571 | $36,353 |
| 2021 | $3,288 | $41,278 | $7,115 | $34,163 |
| 2020 | $3,241 | $39,921 | $6,881 | $33,040 |
| 2019 | $3,015 | $37,840 | $6,522 | $31,318 |
| 2018 | $3,530 | $36,384 | $6,271 | $30,113 |
| 2017 | $2,817 | $34,347 | $5,920 | $28,427 |
| 2016 | $2,898 | $34,429 | $5,934 | $28,495 |
| 2015 | $3,030 | $32,758 | $5,646 | $27,112 |
| 2014 | $3,030 | $31,804 | $5,482 | $26,322 |
| 2013 | $3,030 | $34,198 | $5,895 | $28,303 |
Source: Public Records
Map
Nearby Homes
- 1061 Ashley Ct S Unit 1A
- 1340 Lacoma Ct
- 1108 E 9th St
- 613 E 3rd St Unit 4
- 613 Katherine St
- 207 Muehl Dr
- 807 Valley Ln
- 540 E 4th St
- 602 Stephanie Dr
- 927 Putnam Dr
- 560 E 7th St
- 1007 Read St
- 1004 Valley Ln
- 317 Bonnie Dr
- 134 S Jefferson St
- 1221 Runyan Dr
- 1413 Strawberry Hill Dr
- 800 Madison St Unit 2C
- 1102 E Treeline Dr
- 219 S Washington St
- 1036 Ashley Ct N Unit 1A
- 1036 Ashley Ct N Unit 3B
- 1036 Ashley Ct N Unit 3A
- 1036 Ashley Ct N Unit 3C
- 1036 Ashley Ct N Unit 1D
- 1036 Ashley Ct N Unit 2D
- 1036 Ashley Ct N Unit 2C
- 1036 Ashley Ct N Unit N1B
- 1036 Ashley Ct N Unit 42B
- 1036 Ashley Ct N Unit 2A
- 1036 Ashley Ct N Unit 43D
- 1036 Ashley Ct N Unit 1C
- 1036 Ashley Ct N Unit 41A
- 1036 Ashley Ct N Unit 1B
- 1053 Ashley Ct N Unit 1
- 1028 Ashley Ct N Unit 1D
- 1028 Ashley Ct N Unit N3A
- 1028 Ashley Ct N Unit 52D
- 1028 Ashley Ct N Unit 2A
- 1028 Ashley Ct N Unit 53D