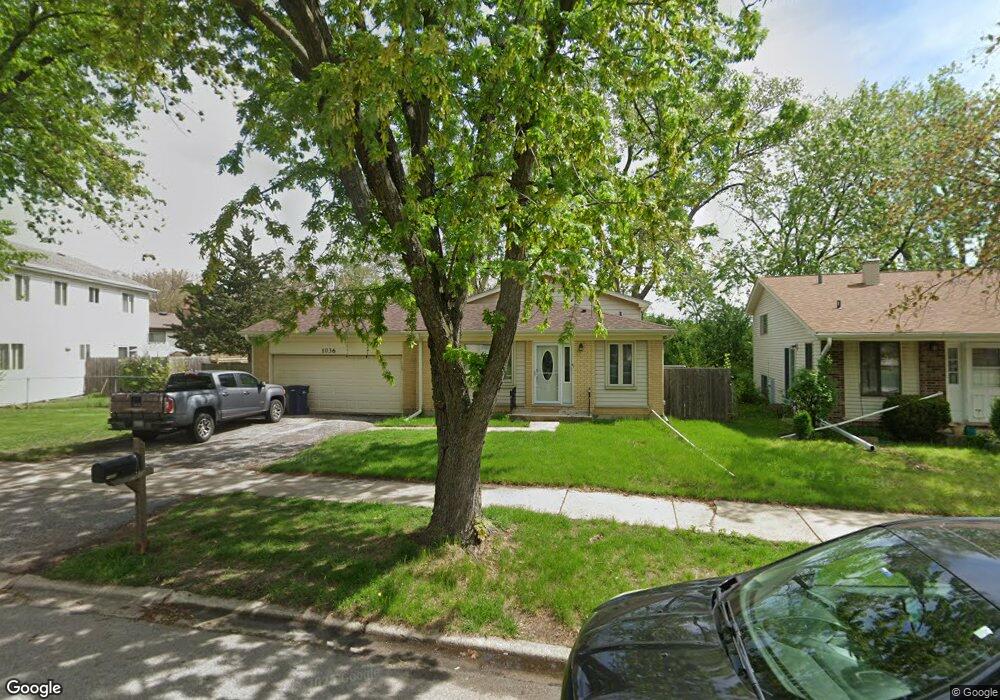
1036 Foxworth Blvd Unit 1 Lombard, IL 60148
Estimated Value: $395,000 - $428,000
3
Beds
2
Baths
1,080
Sq Ft
$379/Sq Ft
Est. Value
About This Home
This home is located at 1036 Foxworth Blvd Unit 1, Lombard, IL 60148 and is currently estimated at $409,053, approximately $378 per square foot. 1036 Foxworth Blvd Unit 1 is a home located in DuPage County with nearby schools including Westfield Elementary School, Glen Crest Middle School, and Glenbard South High School.
Ownership History
Date
Name
Owned For
Owner Type
Purchase Details
Closed on
Dec 14, 2010
Sold by
Wells Fargo Bank Na
Bought by
Weiberg Eric
Current Estimated Value
Home Financials for this Owner
Home Financials are based on the most recent Mortgage that was taken out on this home.
Original Mortgage
$165,690
Outstanding Balance
$111,017
Interest Rate
4.5%
Mortgage Type
FHA
Estimated Equity
$298,036
Purchase Details
Closed on
Feb 23, 2010
Sold by
Varghese Johny and Varghese Shiny
Bought by
Wachovia Mortgage Fsb and World Savings Bank
Purchase Details
Closed on
Sep 5, 2003
Sold by
Pullukat Minu Simon
Bought by
Varghese Johny and Varghese Shini
Home Financials for this Owner
Home Financials are based on the most recent Mortgage that was taken out on this home.
Original Mortgage
$169,600
Interest Rate
6.43%
Mortgage Type
Stand Alone First
Purchase Details
Closed on
May 6, 2003
Sold by
Pullukat Reni G
Bought by
Pullukat Minu Simon
Purchase Details
Closed on
Dec 22, 1995
Sold by
Garrett Kenneth M and Garrett Evelyn G
Bought by
Pullukat Minu Simon and Pullukat Reni G
Home Financials for this Owner
Home Financials are based on the most recent Mortgage that was taken out on this home.
Original Mortgage
$119,200
Interest Rate
7.42%
Create a Home Valuation Report for This Property
The Home Valuation Report is an in-depth analysis detailing your home's value as well as a comparison with similar homes in the area
Home Values in the Area
Average Home Value in this Area
Purchase History
| Date | Buyer | Sale Price | Title Company |
|---|---|---|---|
| Weiberg Eric | $170,000 | Premier Title | |
| Wachovia Mortgage Fsb | -- | None Available | |
| Varghese Johny | $212,000 | Atg | |
| Pullukat Minu Simon | -- | -- | |
| Pullukat Minu Simon | $149,000 | -- |
Source: Public Records
Mortgage History
| Date | Status | Borrower | Loan Amount |
|---|---|---|---|
| Open | Weiberg Eric | $165,690 | |
| Previous Owner | Varghese Johny | $169,600 | |
| Previous Owner | Pullukat Minu Simon | $119,200 |
Source: Public Records
Tax History Compared to Growth
Tax History
| Year | Tax Paid | Tax Assessment Tax Assessment Total Assessment is a certain percentage of the fair market value that is determined by local assessors to be the total taxable value of land and additions on the property. | Land | Improvement |
|---|---|---|---|---|
| 2024 | $7,922 | $111,334 | $28,844 | $82,490 |
| 2023 | $7,543 | $102,480 | $26,550 | $75,930 |
| 2022 | $7,194 | $96,850 | $25,090 | $71,760 |
| 2021 | $7,015 | $94,550 | $24,490 | $70,060 |
| 2020 | $7,051 | $93,670 | $24,260 | $69,410 |
| 2019 | $6,855 | $91,200 | $23,620 | $67,580 |
| 2018 | $6,909 | $90,680 | $22,250 | $68,430 |
| 2017 | $6,401 | $87,340 | $21,430 | $65,910 |
| 2016 | $6,302 | $83,850 | $20,570 | $63,280 |
| 2015 | $6,074 | $79,990 | $19,620 | $60,370 |
| 2014 | $5,605 | $73,010 | $19,480 | $53,530 |
| 2013 | $5,366 | $73,230 | $19,540 | $53,690 |
Source: Public Records
Map
Nearby Homes
- 1073 Foxworth Blvd
- 2100 S Lloyd Ave
- 1151 Whitehall St
- 1128 Hunter St
- 947 Aspen Dr
- 2S225 Lawler Ln
- 2S137 Beaumont Ln Unit 9
- 2005 S Finley Rd Unit 901
- 2005 S Finley Rd Unit 1204
- 2005 S Finley Rd Unit 1102
- 2005 S Finley Rd Unit 1107
- 2005 S Finley Rd Unit 1209
- 2005 S Finley Rd Unit 704
- 2S200 Valley Rd
- 484 Woodmoor Dr
- 2015 S Finley Rd Unit 903
- 1S217 Valley Rd
- 21W117 Glen Park Rd
- 298 Gazebo Ln Unit 47
- 450 Manor Hill Ln
- 1030 Foxworth Blvd
- 1042 Foxworth Blvd
- 1024 Foxworth Blvd
- 1048 Foxworth Blvd
- 1033 Foxworth Blvd
- 1045 Foxworth Blvd
- 1021 Foxworth Blvd
- 1018 Foxworth Blvd
- 1057 Foxworth Blvd
- 1054 Foxworth Blvd Unit 1
- 1000 Hunter St
- 1012 Foxworth Blvd
- 1065 Beverly Ct
- 1069 Foxworth Blvd
- 1060 Foxworth Blvd
- 1057 Beverly Ct
- 1073 Beverly Ct
- 1072 Foxworth Blvd
- 1010 Hunter St
- 1066 Foxworth Blvd