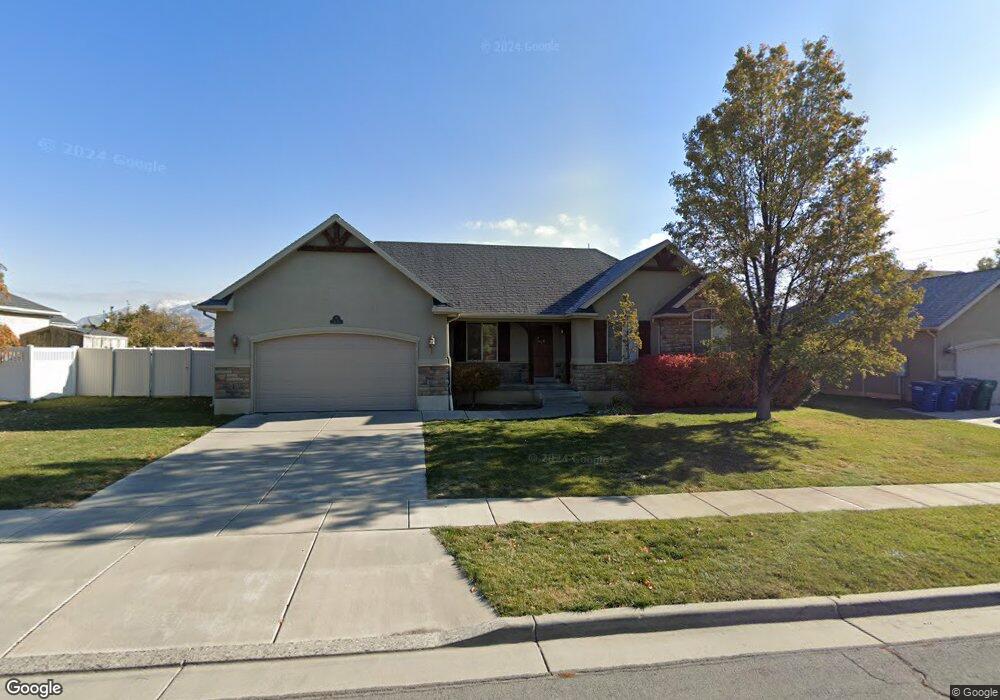
1036 N 2325 W Layton, UT 84041
Estimated Value: $548,063 - $623,000
3
Beds
2
Baths
2,679
Sq Ft
$215/Sq Ft
Est. Value
About This Home
This home is located at 1036 N 2325 W, Layton, UT 84041 and is currently estimated at $575,516, approximately $214 per square foot. 1036 N 2325 W is a home located in Davis County with nearby schools including Ellison Park School, Shoreline Junior High School, and Layton High School.
Ownership History
Date
Name
Owned For
Owner Type
Purchase Details
Closed on
Dec 4, 2012
Sold by
Filmoehala Nicholas C and Filmoehala Chelsey S
Bought by
Carter Casey S and Carter Lisa J
Current Estimated Value
Home Financials for this Owner
Home Financials are based on the most recent Mortgage that was taken out on this home.
Original Mortgage
$216,600
Outstanding Balance
$149,462
Interest Rate
3.36%
Mortgage Type
New Conventional
Estimated Equity
$426,054
Purchase Details
Closed on
Feb 26, 2004
Sold by
Destination Homes Inc
Bought by
Filimoehala Nicholas C and Filimoehala Chelsey S
Home Financials for this Owner
Home Financials are based on the most recent Mortgage that was taken out on this home.
Original Mortgage
$144,972
Interest Rate
4.75%
Mortgage Type
Purchase Money Mortgage
Create a Home Valuation Report for This Property
The Home Valuation Report is an in-depth analysis detailing your home's value as well as a comparison with similar homes in the area
Home Values in the Area
Average Home Value in this Area
Purchase History
| Date | Buyer | Sale Price | Title Company |
|---|---|---|---|
| Carter Casey S | -- | First American Title Company | |
| Filimoehala Nicholas C | -- | Bonneville Title Company Inc |
Source: Public Records
Mortgage History
| Date | Status | Borrower | Loan Amount |
|---|---|---|---|
| Open | Carter Casey S | $216,600 | |
| Previous Owner | Filimoehala Nicholas C | $144,972 | |
| Closed | Filimoehala Nicholas C | $27,182 |
Source: Public Records
Tax History Compared to Growth
Tax History
| Year | Tax Paid | Tax Assessment Tax Assessment Total Assessment is a certain percentage of the fair market value that is determined by local assessors to be the total taxable value of land and additions on the property. | Land | Improvement |
|---|---|---|---|---|
| 2025 | $2,641 | $277,200 | $112,113 | $165,087 |
| 2024 | $2,627 | $277,751 | $123,767 | $153,984 |
| 2023 | $2,640 | $492,000 | $122,970 | $369,030 |
| 2022 | $2,684 | $271,700 | $76,564 | $195,136 |
| 2021 | $2,597 | $392,000 | $114,869 | $277,131 |
| 2020 | $2,348 | $340,000 | $96,709 | $243,291 |
| 2019 | $2,235 | $317,000 | $99,191 | $217,809 |
| 2018 | $2,051 | $292,000 | $87,002 | $204,998 |
| 2016 | $1,786 | $131,175 | $34,198 | $96,977 |
| 2015 | $1,821 | $126,995 | $34,038 | $92,957 |
| 2014 | $1,764 | $121,000 | $34,038 | $86,962 |
| 2013 | -- | $126,500 | $34,742 | $91,758 |
Source: Public Records
Map
Nearby Homes
- 1071 Jamie-Matt Cir
- 2115 W 1225 N
- 2153 W 775 N
- 2631 W 1075 N
- 2543 W 1275 N
- 2036 W 775 N
- 818 N 2625 W
- 2025 W 775 N
- 2438 W 1400 N
- 979 Cold Creek Way
- 1430 N 2100 W
- 1452 N 1875 W Unit 146
- 1451 N 1875 W Unit 168
- 1455 N 1875 W Unit 167
- 1459 N 1875 W
- 1459 N 1875 W Unit 166
- 1463 N 1875 W Unit 165
- 1463 N 1875 W
- 1479 N 1875 W
- 1479 N 1875 W Unit 161