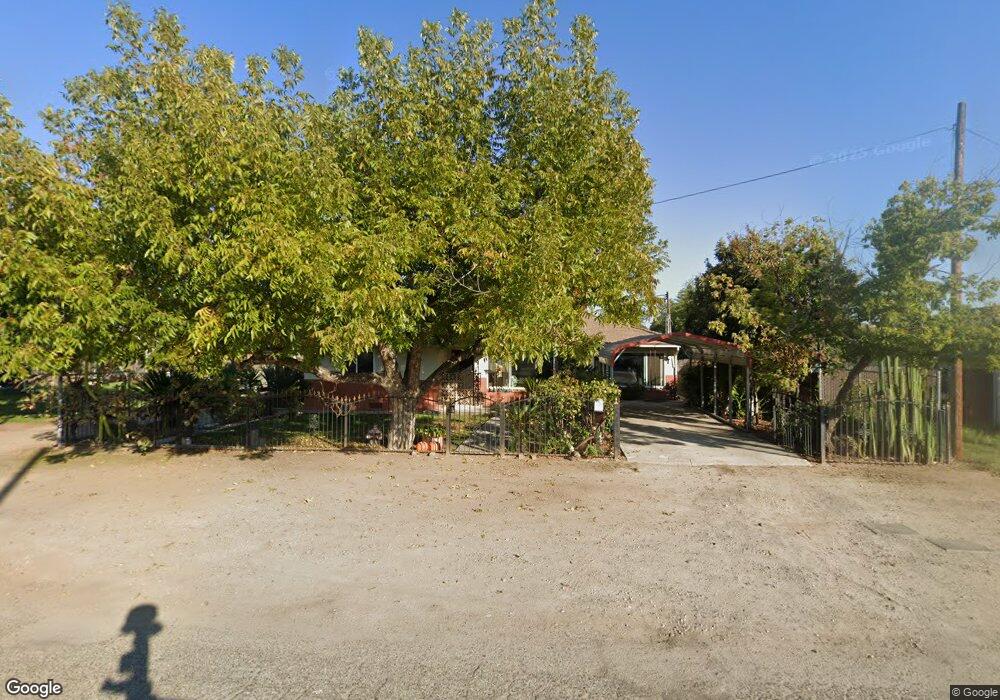
1036 N Winery Ave Fresno, CA 93727
Roosevelt NeighborhoodEstimated Value: $347,000 - $371,000
3
Beds
2
Baths
1,652
Sq Ft
$218/Sq Ft
Est. Value
About This Home
This home is located at 1036 N Winery Ave, Fresno, CA 93727 and is currently estimated at $359,968, approximately $217 per square foot. 1036 N Winery Ave is a home located in Fresno County with nearby schools including Ewing Elementary School, Scandinavian Middle School, and Mclane High School.
Ownership History
Date
Name
Owned For
Owner Type
Purchase Details
Closed on
Aug 29, 2000
Sold by
Singh Gilbert S and Ann Paula
Bought by
Singh Paula Ann
Current Estimated Value
Home Financials for this Owner
Home Financials are based on the most recent Mortgage that was taken out on this home.
Original Mortgage
$112,042
Outstanding Balance
$41,125
Interest Rate
8.2%
Estimated Equity
$318,843
Purchase Details
Closed on
Jul 2, 1997
Sold by
Singh Paula Ann
Bought by
Singh Gilbert S and Singh Paula Ann
Purchase Details
Closed on
Jun 5, 1997
Sold by
Singh Gilbert S
Bought by
Singh Paula Ann
Home Financials for this Owner
Home Financials are based on the most recent Mortgage that was taken out on this home.
Original Mortgage
$80,382
Interest Rate
7.98%
Mortgage Type
FHA
Purchase Details
Closed on
Apr 11, 1997
Sold by
Saldana Henry M and Irma Lorenza
Bought by
Singh Paula Ann
Home Financials for this Owner
Home Financials are based on the most recent Mortgage that was taken out on this home.
Original Mortgage
$80,382
Interest Rate
7.98%
Mortgage Type
FHA
Create a Home Valuation Report for This Property
The Home Valuation Report is an in-depth analysis detailing your home's value as well as a comparison with similar homes in the area
Home Values in the Area
Average Home Value in this Area
Purchase History
| Date | Buyer | Sale Price | Title Company |
|---|---|---|---|
| Singh Paula Ann | -- | Fidelity National Title Co | |
| Singh Gilbert S | -- | Fidelity National Title Co | |
| Singh Paula Ann | -- | Fidelity National Title Co | |
| Singh Paula Ann | $82,000 | Fidelity National Title Co |
Source: Public Records
Mortgage History
| Date | Status | Borrower | Loan Amount |
|---|---|---|---|
| Open | Singh Paula Ann | $112,042 | |
| Previous Owner | Singh Paula Ann | $80,382 |
Source: Public Records
Tax History Compared to Growth
Tax History
| Year | Tax Paid | Tax Assessment Tax Assessment Total Assessment is a certain percentage of the fair market value that is determined by local assessors to be the total taxable value of land and additions on the property. | Land | Improvement |
|---|---|---|---|---|
| 2025 | $1,715 | $133,524 | $40,702 | $92,822 |
| 2023 | $1,618 | $128,340 | $39,122 | $89,218 |
| 2022 | $1,597 | $125,824 | $38,355 | $87,469 |
| 2021 | $1,553 | $123,357 | $37,603 | $85,754 |
| 2020 | $1,547 | $122,093 | $37,218 | $84,875 |
| 2019 | $1,487 | $119,700 | $36,489 | $83,211 |
| 2018 | $1,455 | $117,354 | $35,774 | $81,580 |
| 2017 | $1,431 | $115,054 | $35,073 | $79,981 |
| 2016 | $1,384 | $112,799 | $34,386 | $78,413 |
| 2015 | $1,363 | $111,106 | $33,870 | $77,236 |
| 2014 | $1,335 | $108,931 | $33,207 | $75,724 |
Source: Public Records
Map
Nearby Homes
- 5009 E Clay Ave
- 5022 E Tyler Ave
- 5082 E Clay Ave
- 1431 N Willow Ave
- 5080 E Hammond Ave
- 605 N Winery Ave
- 4774 E Hammond Ave
- 4921 E Oslin Ave
- 4904 E Weathermaker Ave
- 1293 N Bailey Ave
- 4984 E Belmont Ave
- 55097 E Carmen Ave
- 1240 N Bailey Ave
- 4959 E Carmen Ave
- 5060 E Weathermaker Ave
- 4731 E Turner Ave
- 4875 E Mckinley Ave Unit 129
- 5181 E Olive Ave Unit 117
- 1745 N Winery Ave Unit multi
- 1745 N Winery Ave Unit 102
- 4905 E Tyler Ave
- 4911 E Tyler Ave
- 4906 E Olive Ave
- 4921 E Tyler Ave
- 4916 E Olive Ave
- 1037 N Winery Ave
- 4922 E Olive Ave
- 4895 E Tyler Ave
- 4894 E Olive Ave
- 4929 E Tyler Ave
- 4891 E Tyler Ave
- 4890 E Olive Ave
- 4914 E Tyler Ave
- 4935 E Tyler Ave
- 4885 E Tyler Ave
- 4920 E Tyler Ave
- 4884 E Olive Ave
- 4938 E Olive Ave
- 4896 E Tyler Ave
- 4879 E Tyler Ave