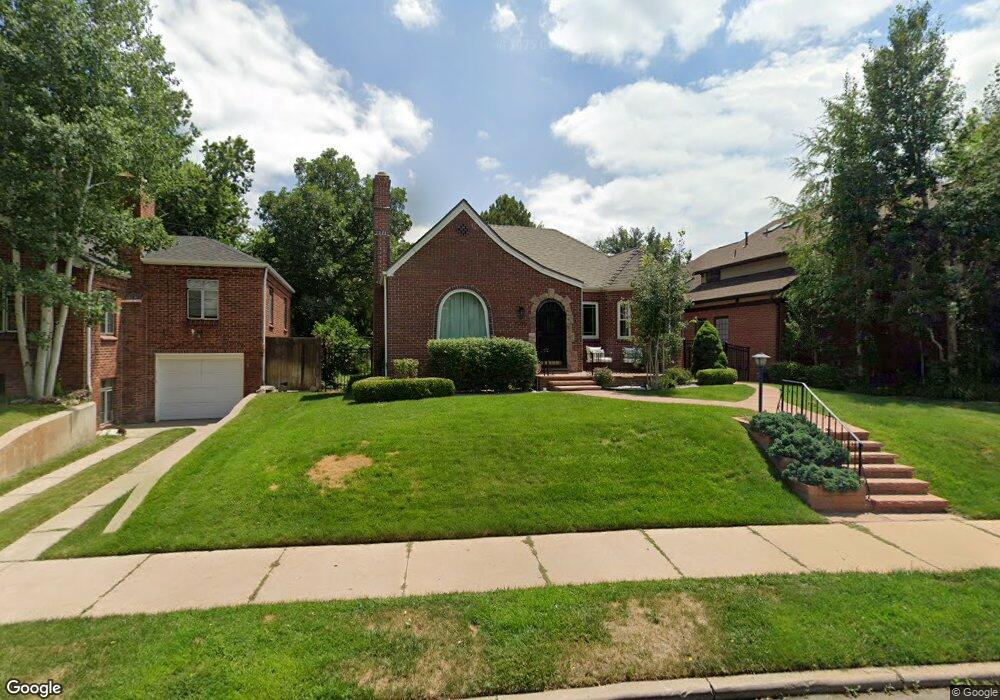
1036 S Fillmore Way Denver, CO 80209
Belcaro NeighborhoodEstimated Value: $1,069,000 - $1,350,000
4
Beds
2
Baths
2,235
Sq Ft
$553/Sq Ft
Est. Value
About This Home
This home is located at 1036 S Fillmore Way, Denver, CO 80209 and is currently estimated at $1,235,724, approximately $552 per square foot. 1036 S Fillmore Way is a home located in Denver County with nearby schools including Cory Elementary School, Merrill Middle School, and South High School.
Ownership History
Date
Name
Owned For
Owner Type
Purchase Details
Closed on
Jan 10, 2022
Sold by
Jdi Llc
Bought by
Greenberg Marni
Current Estimated Value
Home Financials for this Owner
Home Financials are based on the most recent Mortgage that was taken out on this home.
Original Mortgage
$940,000
Outstanding Balance
$866,441
Interest Rate
3.12%
Mortgage Type
New Conventional
Estimated Equity
$369,284
Purchase Details
Closed on
Jul 14, 2021
Sold by
Shearer Phillip C
Bought by
Jdi Llc
Purchase Details
Closed on
Feb 28, 2013
Sold by
Shearer Phillip C and Shearer Robert D
Bought by
Shearer Phillip C
Purchase Details
Closed on
Sep 1, 2011
Sold by
Shearer Leila Marie
Bought by
Leila Marie Shearer Revocable Trust
Purchase Details
Closed on
Feb 25, 1997
Sold by
Marie Shearer Leila
Bought by
Shearer Leila Marie
Create a Home Valuation Report for This Property
The Home Valuation Report is an in-depth analysis detailing your home's value as well as a comparison with similar homes in the area
Home Values in the Area
Average Home Value in this Area
Purchase History
| Date | Buyer | Sale Price | Title Company |
|---|---|---|---|
| Greenberg Marni | $1,225,000 | None Listed On Document | |
| Jdi Llc | $750,000 | Heritage Title Company | |
| Shearer Phillip C | -- | None Available | |
| Leila Marie Shearer Revocable Trust | -- | None Available | |
| Shearer Leila Marie | -- | -- |
Source: Public Records
Mortgage History
| Date | Status | Borrower | Loan Amount |
|---|---|---|---|
| Open | Greenberg Marni | $940,000 |
Source: Public Records
Tax History Compared to Growth
Tax History
| Year | Tax Paid | Tax Assessment Tax Assessment Total Assessment is a certain percentage of the fair market value that is determined by local assessors to be the total taxable value of land and additions on the property. | Land | Improvement |
|---|---|---|---|---|
| 2024 | $6,322 | $79,820 | $43,700 | $36,120 |
| 2023 | $6,185 | $79,820 | $43,700 | $36,120 |
| 2022 | $3,969 | $49,910 | $38,980 | $10,930 |
| 2021 | $3,832 | $51,350 | $40,100 | $11,250 |
| 2020 | $3,687 | $49,690 | $33,130 | $16,560 |
| 2019 | $3,583 | $49,690 | $33,130 | $16,560 |
| 2018 | $3,139 | $40,570 | $29,840 | $10,730 |
| 2017 | $3,129 | $40,570 | $29,840 | $10,730 |
| 2016 | $3,050 | $37,400 | $27,175 | $10,225 |
| 2015 | $2,922 | $37,400 | $27,175 | $10,225 |
| 2014 | $2,547 | $30,670 | $21,221 | $9,449 |
Source: Public Records
Map
Nearby Homes
- 1056 S Clayton Way
- 1090 Bonnie Brae Blvd
- 949 S Clayton Way
- 1055 S Cove Way
- 1160 S Steele St
- 950 S Steele St
- 1030 S Adams St
- 870 S Medea Way
- 1026 S Cook St
- 824 S Medea Way
- 725 S Cove Way
- 1117 S Madison St
- 801 S Medea Way
- 1311 S Steele St
- 792 S Clayton St
- 1275 S Columbine St
- 1127 S Monroe St
- 1377 S Saint Paul St
- 1160 S Monroe St
- 707 S Fillmore St
- 1030 S Fillmore Way
- 1040 S Fillmore Way
- 1010 S Fillmore Way
- 1041 S Milwaukee Way
- 1054 S Fillmore Way
- 1045 S Milwaukee Way
- 1025 S Milwaukee Way
- 1004 S Fillmore Way
- 1055 S Milwaukee Way
- 1045 S Fillmore Way
- 1070 S Fillmore Way
- 1051 S Fillmore Way
- 1021 S Milwaukee Way
- 1000 S Fillmore Way
- 1000 S Fillmore Way
- 1059 S Milwaukee Way
- 1015 S Milwaukee Way
- 1055 S Fillmore Way
- 1080 S Fillmore Way
- 1015 Bonnie Brae Blvd