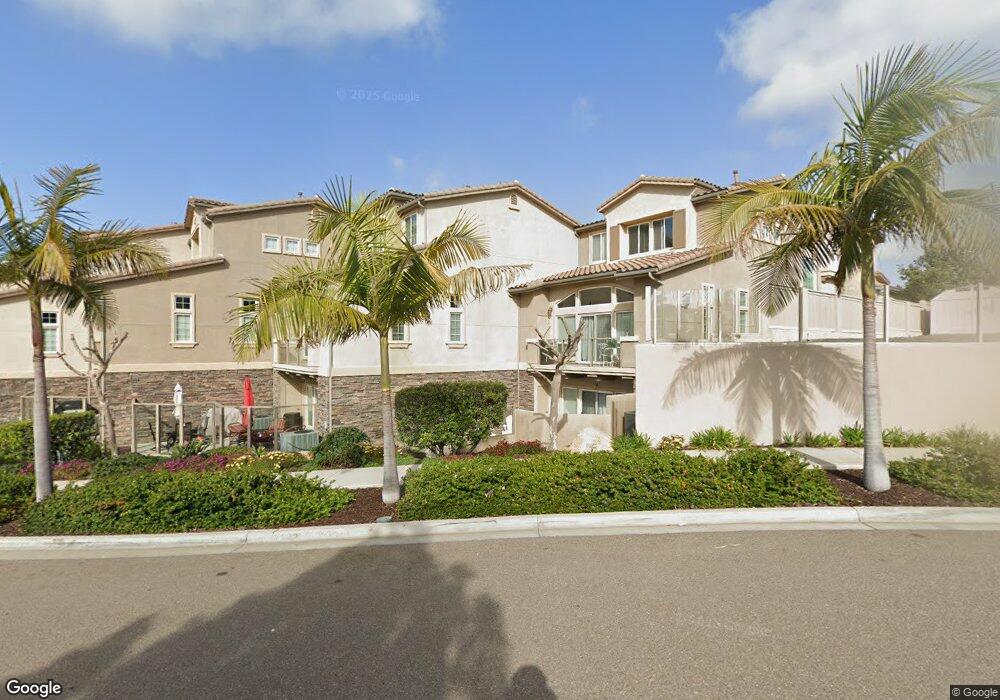
1036 Scenic Way Unit 701 Carlsbad, CA 92008
Hedionda Point NeighborhoodEstimated Value: $1,075,000 - $1,308,428
3
Beds
3
Baths
2,112
Sq Ft
$578/Sq Ft
Est. Value
About This Home
This home is located at 1036 Scenic Way Unit 701, Carlsbad, CA 92008 and is currently estimated at $1,220,107, approximately $577 per square foot. 1036 Scenic Way Unit 701 is a home located in San Diego County with nearby schools including Magnolia Elementary, Carlsbad High School, and Sage Creek High.
Ownership History
Date
Name
Owned For
Owner Type
Purchase Details
Closed on
Mar 22, 2017
Sold by
Hill Susan Ellen
Bought by
Morris Dennis D and Morris Cynthia
Current Estimated Value
Home Financials for this Owner
Home Financials are based on the most recent Mortgage that was taken out on this home.
Original Mortgage
$592,500
Outstanding Balance
$487,182
Interest Rate
3.87%
Mortgage Type
Adjustable Rate Mortgage/ARM
Estimated Equity
$732,925
Purchase Details
Closed on
Sep 19, 2007
Sold by
Hill Susan E
Bought by
Hill Susan Ellen
Purchase Details
Closed on
May 24, 2007
Sold by
Anastasi Development Co Llc
Bought by
Hill Susan E
Home Financials for this Owner
Home Financials are based on the most recent Mortgage that was taken out on this home.
Original Mortgage
$500,000
Interest Rate
6.87%
Mortgage Type
New Conventional
Create a Home Valuation Report for This Property
The Home Valuation Report is an in-depth analysis detailing your home's value as well as a comparison with similar homes in the area
Home Values in the Area
Average Home Value in this Area
Purchase History
| Date | Buyer | Sale Price | Title Company |
|---|---|---|---|
| Morris Dennis D | $790,000 | Fidelity National Title Co | |
| Hill Susan Ellen | -- | Accommodation | |
| Hill Susan E | $750,000 | None Available |
Source: Public Records
Mortgage History
| Date | Status | Borrower | Loan Amount |
|---|---|---|---|
| Open | Morris Dennis D | $592,500 | |
| Previous Owner | Hill Susan E | $500,000 |
Source: Public Records
Tax History Compared to Growth
Tax History
| Year | Tax Paid | Tax Assessment Tax Assessment Total Assessment is a certain percentage of the fair market value that is determined by local assessors to be the total taxable value of land and additions on the property. | Land | Improvement |
|---|---|---|---|---|
| 2025 | $9,590 | $916,854 | $594,375 | $322,479 |
| 2024 | $9,590 | $898,877 | $582,721 | $316,156 |
| 2023 | $9,541 | $881,253 | $571,296 | $309,957 |
| 2022 | $9,394 | $863,975 | $560,095 | $303,880 |
| 2021 | $9,324 | $847,035 | $549,113 | $297,922 |
| 2020 | $9,261 | $838,351 | $543,483 | $294,868 |
| 2019 | $9,093 | $821,914 | $532,827 | $289,087 |
| 2018 | $8,708 | $805,799 | $522,380 | $283,419 |
| 2017 | $7,786 | $725,000 | $470,000 | $255,000 |
| 2016 | $6,829 | $650,000 | $422,000 | $228,000 |
| 2015 | $6,745 | $635,000 | $413,000 | $222,000 |
| 2014 | $6,228 | $585,000 | $381,000 | $204,000 |
Source: Public Records
Map
Nearby Homes
- 4031 Aidan Cir Unit 1205
- 4007 Bluff View Way
- 1170 Chinquapin Ave
- 0 Hoover St
- 1095 Hoover St
- 801 Kalpati Cir Unit B
- 1199 Tamarack Ave
- 4007 Canario St Unit E
- 4000 James Dr
- 0 Adams St Unit OC24201399
- 334 Date Ave
- 324 Chinquapin Ave
- 320 Chinquapin Ave
- 314 Chinquapin Ave
- 310-326 Chinquapin Ave
- 370 Tamarack Ave
- 1741 Bruce Rd
- 3575 Madison St
- 368 Hemlock Ave
- 111 Sequoia Ave Unit C
- 4036 Aida Cir
- 4035 Bluff View Way
- 4033 Bluff View Way
- 1044 Scenic Way Unit 705
- 1042 Scenic Way
- 1040 Scenic Way
- 1038 Scenic Way
- 1037 Loretta Ln Unit 602
- 1035 Loretta Ln
- 4031 Bluff View Way Unit 401
- 4039 Bluff View Way Unit 405
- 4037 Bluff View Way
- 1039 Loretta Ln
- 4034 Aidan Cir Unit 1403
- 1032 Point Way
- 1041 Loretta Ln Unit 604
- 4038 Aidan Cir
- 4036 Aidan Cir
- 4032 Aidan Cir
- 1028 Point Way Unit 903