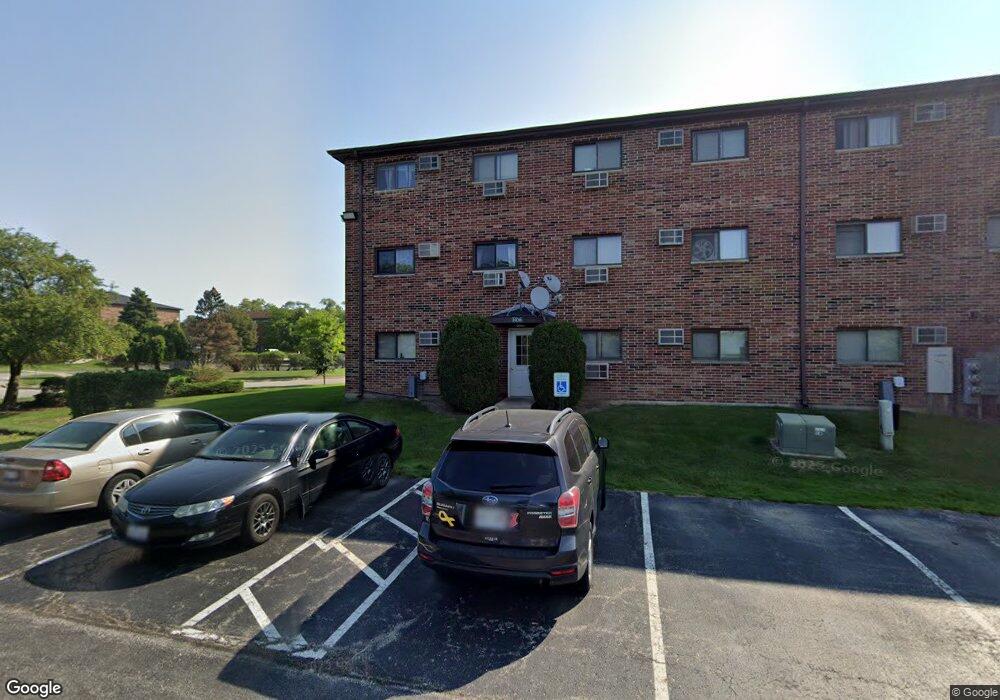
1036 Spruce St Unit 1A Glendale Heights, IL 60139
Estimated Value: $168,000 - $184,633
2
Beds
1
Bath
817
Sq Ft
$213/Sq Ft
Est. Value
About This Home
This home is located at 1036 Spruce St Unit 1A, Glendale Heights, IL 60139 and is currently estimated at $174,408, approximately $213 per square foot. 1036 Spruce St Unit 1A is a home located in DuPage County with nearby schools including Churchill Elementary School, Hadley Junior High School, and Glenbard West High School.
Ownership History
Date
Name
Owned For
Owner Type
Purchase Details
Closed on
Mar 1, 2006
Sold by
Lazzara Maria
Bought by
Lazzara Frank
Current Estimated Value
Purchase Details
Closed on
Oct 15, 2001
Sold by
Santini Sandra R
Bought by
Lazzara Carmelo and Lazzara Rosa
Purchase Details
Closed on
Dec 5, 1994
Sold by
Suhi Linda and Kornovich June V
Bought by
Santini Sandra R
Home Financials for this Owner
Home Financials are based on the most recent Mortgage that was taken out on this home.
Original Mortgage
$50,000
Interest Rate
9.06%
Create a Home Valuation Report for This Property
The Home Valuation Report is an in-depth analysis detailing your home's value as well as a comparison with similar homes in the area
Home Values in the Area
Average Home Value in this Area
Purchase History
| Date | Buyer | Sale Price | Title Company |
|---|---|---|---|
| Lazzara Frank | -- | None Available | |
| Lazzara Carmelo | $86,000 | Lawyers Title Insurance Corp | |
| Santini Sandra R | $67,000 | Attorneys Title Guaranty Fun |
Source: Public Records
Mortgage History
| Date | Status | Borrower | Loan Amount |
|---|---|---|---|
| Previous Owner | Santini Sandra R | $50,000 |
Source: Public Records
Tax History Compared to Growth
Tax History
| Year | Tax Paid | Tax Assessment Tax Assessment Total Assessment is a certain percentage of the fair market value that is determined by local assessors to be the total taxable value of land and additions on the property. | Land | Improvement |
|---|---|---|---|---|
| 2024 | $3,640 | $43,488 | $3,107 | $40,381 |
| 2023 | $3,499 | $40,030 | $2,860 | $37,170 |
| 2022 | $3,043 | $34,110 | $2,710 | $31,400 |
| 2021 | $1,897 | $27,300 | $2,170 | $25,130 |
| 2020 | $1,701 | $25,210 | $2,150 | $23,060 |
| 2019 | $1,650 | $24,540 | $2,090 | $22,450 |
| 2018 | $1,318 | $20,240 | $1,960 | $18,280 |
| 2017 | $993 | $16,320 | $1,580 | $14,740 |
| 2016 | $989 | $15,670 | $1,520 | $14,150 |
| 2015 | $964 | $14,950 | $1,450 | $13,500 |
| 2014 | $1,039 | $15,440 | $1,500 | $13,940 |
| 2013 | $2,903 | $33,640 | $3,250 | $30,390 |
Source: Public Records
Map
Nearby Homes
- 1002 Spruce St Unit 2B
- 277 Shorewood Dr Unit 2A
- 270 Shorewood Dr Unit GA
- 373 Evergreen Cir Unit 124
- 208 Shorewood Dr Unit 3-2C
- 222 Shorewood Dr Unit GD
- 1111 Bloomingdale Rd Unit 2B
- 1N713 Evergreen Ave
- 2N061 Bloomingdale Rd
- 1N450 Highland Ave
- 479 James Ct Unit D
- 1295 Pearl Ave Unit D
- 419 Sidney Ave Unit C
- 449 Geneva Rd
- 1277 Prairie Ave Unit C
- 22W474 Emerson Ave
- 488 Darlene Ln Unit D
- 1N742 Forest Ave
- 462 S President St Unit 202
- 23W285 Armitage Ave
- 1032 Spruce St Unit 1A
- 1032 Spruce St Unit 2A
- 1032 Spruce St Unit 1B
- 1034 Spruce St Unit 1A
- 1034 Spruce St Unit 2A
- 1032 Spruce St Unit 3B
- 1034 Spruce St Unit 2B
- 1032 Spruce St Unit 3A
- 1034 Spruce St Unit 3B
- 1034 Spruce St Unit 3A
- 1034 Spruce St Unit 1B
- 1036 Spruce St Unit 2B
- 1036 Spruce St Unit 1B
- 1036 Spruce St Unit 3A
- 1036 Spruce St Unit 2A
- 1036 Spruce St Unit 3B
- 1000 Spruce St Unit 3B
- 1000 Spruce St Unit 1B
- 1004 Spruce St Unit 2A