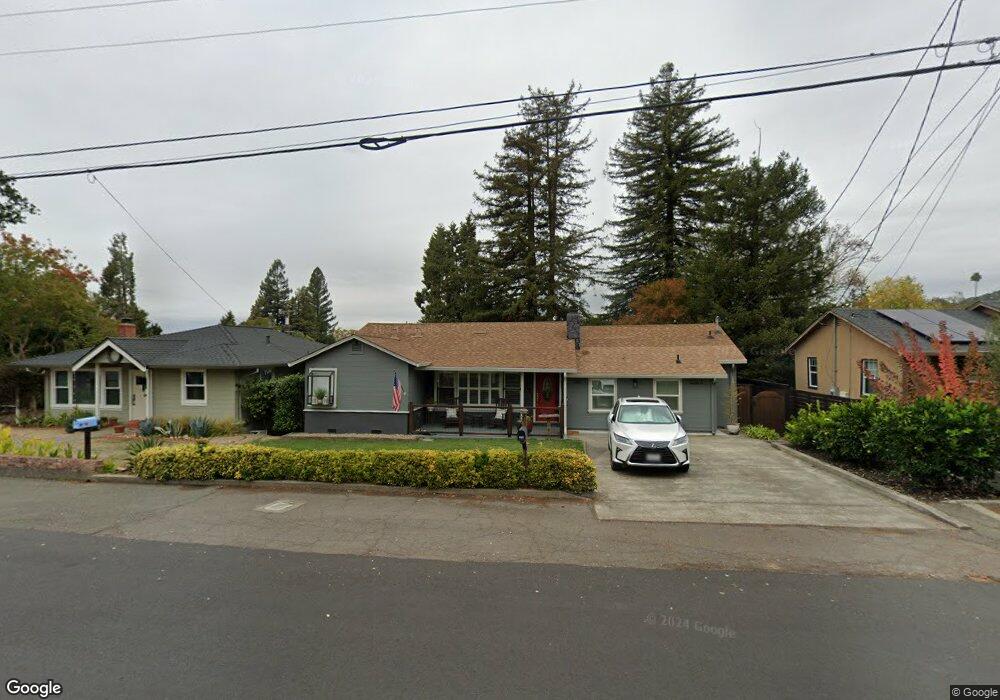
1036 Summit Ave Napa, CA 94559
Alta Heights NeighborhoodEstimated Value: $948,000 - $1,295,000
3
Beds
3
Baths
1,824
Sq Ft
$601/Sq Ft
Est. Value
About This Home
This home is located at 1036 Summit Ave, Napa, CA 94559 and is currently estimated at $1,095,712, approximately $600 per square foot. 1036 Summit Ave is a home located in Napa County with nearby schools including Alta Heights Elementary School, Silverado Middle School, and Napa High School.
Ownership History
Date
Name
Owned For
Owner Type
Purchase Details
Closed on
Nov 26, 2018
Sold by
Savage Joseph M and Savage Linda K
Bought by
Savage Joseph M and Savage Linda K
Current Estimated Value
Purchase Details
Closed on
Sep 18, 1997
Sold by
Darlington Ronald M
Bought by
Savage Joseph M and Savage Linda K
Home Financials for this Owner
Home Financials are based on the most recent Mortgage that was taken out on this home.
Original Mortgage
$159,750
Outstanding Balance
$24,692
Interest Rate
7.44%
Estimated Equity
$1,071,020
Purchase Details
Closed on
Jan 26, 1995
Sold by
Darlington Charlene J
Bought by
Darlington Ronald M
Home Financials for this Owner
Home Financials are based on the most recent Mortgage that was taken out on this home.
Original Mortgage
$144,000
Interest Rate
9.21%
Create a Home Valuation Report for This Property
The Home Valuation Report is an in-depth analysis detailing your home's value as well as a comparison with similar homes in the area
Home Values in the Area
Average Home Value in this Area
Purchase History
| Date | Buyer | Sale Price | Title Company |
|---|---|---|---|
| Savage Joseph M | -- | None Available | |
| Savage Joseph M | $177,500 | Chicago Title Co | |
| Darlington Ronald M | -- | Empire Title Company |
Source: Public Records
Mortgage History
| Date | Status | Borrower | Loan Amount |
|---|---|---|---|
| Open | Savage Joseph M | $159,750 | |
| Previous Owner | Darlington Ronald M | $144,000 |
Source: Public Records
Tax History
| Year | Tax Paid | Tax Assessment Tax Assessment Total Assessment is a certain percentage of the fair market value that is determined by local assessors to be the total taxable value of land and additions on the property. | Land | Improvement |
|---|---|---|---|---|
| 2025 | $4,350 | $458,305 | $143,695 | $314,610 |
| 2024 | $4,260 | $449,320 | $140,878 | $308,442 |
| 2023 | $4,260 | $347,511 | $138,116 | $209,395 |
| 2022 | $2,925 | $340,698 | $135,408 | $205,290 |
| 2021 | $4,461 | $334,018 | $132,753 | $201,265 |
| 2020 | $4,429 | $330,594 | $131,392 | $199,202 |
| 2019 | $4,330 | $324,113 | $128,816 | $195,297 |
| 2018 | $4,260 | $317,759 | $126,291 | $191,468 |
| 2017 | $4,163 | $311,529 | $123,815 | $187,714 |
| 2016 | $4,050 | $305,422 | $121,388 | $184,034 |
| 2015 | $3,775 | $300,835 | $119,565 | $181,270 |
| 2014 | $3,714 | $294,943 | $117,223 | $177,720 |
Source: Public Records
Map
Nearby Homes
- 1701 Meek Ave
- 1415 East Ave
- 3 Highland Dr
- 1747 Silverado Trail
- 225 Berna Ave
- 137 Acacia Ave
- 1212 East Ave
- 1145 Alta Ave
- 1450 Sproul Ave
- 1120 Evans Ave
- 2420 Shoreline Dr
- 0 Montecito Blvd
- 559 E Spring St
- 0 Silverado Trail Unit 325079451
- 0 Silverado Trail Unit 326009573
- 345 Ashlar Dr
- 1314 Mckinstry St Unit 2008
- 1314 Mckinstry St Unit 2056
- 1026 East Ave
- 1008 Evans Ave
Your Personal Tour Guide
Ask me questions while you tour the home.