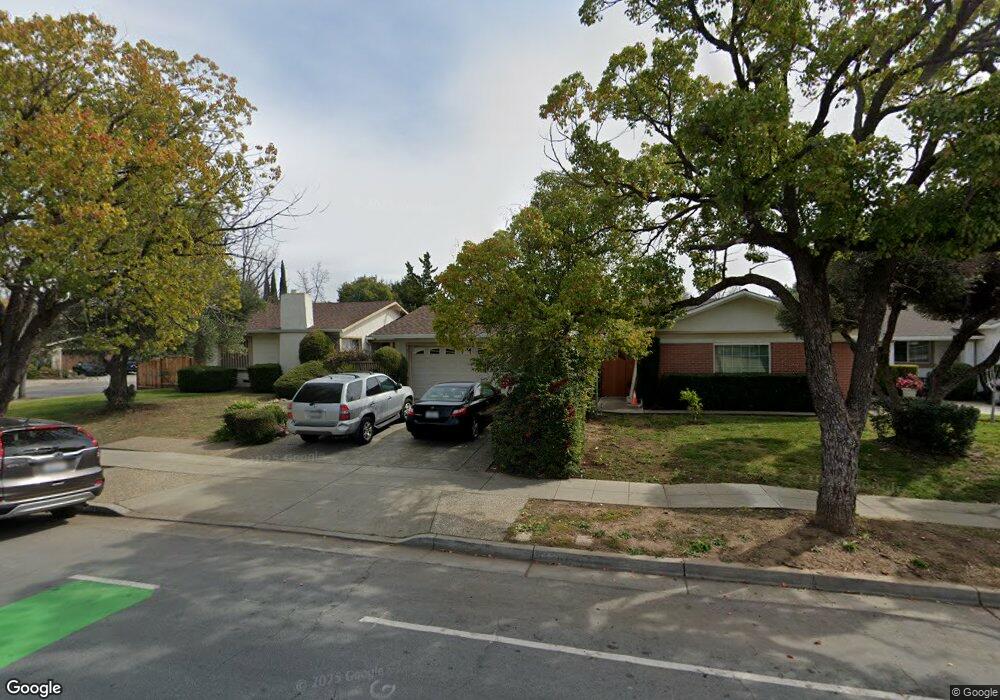
1036 Via Valiente San Jose, CA 95120
Graystone NeighborhoodEstimated Value: $2,152,243 - $2,467,000
4
Beds
2
Baths
2,157
Sq Ft
$1,094/Sq Ft
Est. Value
About This Home
This home is located at 1036 Via Valiente, San Jose, CA 95120 and is currently estimated at $2,360,561, approximately $1,094 per square foot. 1036 Via Valiente is a home located in Santa Clara County with nearby schools including Graystone Elementary School, Bret Harte Middle School, and Leland High School.
Ownership History
Date
Name
Owned For
Owner Type
Purchase Details
Closed on
Mar 14, 2019
Sold by
Do Thomas N
Bought by
Do Thomas N and Thomas N Do 2019 Revocable Tru
Current Estimated Value
Purchase Details
Closed on
Jan 5, 2015
Sold by
Do Hanh D
Bought by
Do Thomas N
Home Financials for this Owner
Home Financials are based on the most recent Mortgage that was taken out on this home.
Original Mortgage
$417,000
Outstanding Balance
$146,493
Interest Rate
3.92%
Mortgage Type
New Conventional
Estimated Equity
$2,214,068
Purchase Details
Closed on
Jan 8, 1997
Sold by
Myers James F and Myers Gail H
Bought by
Do Thomas N and Do Hannah
Home Financials for this Owner
Home Financials are based on the most recent Mortgage that was taken out on this home.
Original Mortgage
$269,200
Interest Rate
7.53%
Create a Home Valuation Report for This Property
The Home Valuation Report is an in-depth analysis detailing your home's value as well as a comparison with similar homes in the area
Home Values in the Area
Average Home Value in this Area
Purchase History
| Date | Buyer | Sale Price | Title Company |
|---|---|---|---|
| Do Thomas N | -- | None Available | |
| Do Thomas N | -- | First American Title Company | |
| Do Thomas N | $336,500 | Old Republic Title Company |
Source: Public Records
Mortgage History
| Date | Status | Borrower | Loan Amount |
|---|---|---|---|
| Open | Do Thomas N | $417,000 | |
| Previous Owner | Do Thomas N | $269,200 |
Source: Public Records
Tax History Compared to Growth
Tax History
| Year | Tax Paid | Tax Assessment Tax Assessment Total Assessment is a certain percentage of the fair market value that is determined by local assessors to be the total taxable value of land and additions on the property. | Land | Improvement |
|---|---|---|---|---|
| 2025 | $12,432 | $971,073 | $650,428 | $320,645 |
| 2024 | $12,432 | $952,033 | $637,675 | $314,358 |
| 2023 | $12,194 | $933,367 | $625,172 | $308,195 |
| 2022 | $12,088 | $915,066 | $612,914 | $302,152 |
| 2021 | $11,839 | $897,125 | $600,897 | $296,228 |
| 2020 | $11,571 | $887,927 | $594,736 | $293,191 |
| 2019 | $11,405 | $870,518 | $583,075 | $287,443 |
| 2018 | $11,293 | $853,450 | $571,643 | $281,807 |
| 2017 | $11,203 | $836,717 | $560,435 | $276,282 |
| 2016 | $11,013 | $820,312 | $549,447 | $270,865 |
| 2015 | $6,546 | $455,996 | $182,396 | $273,600 |
| 2014 | $6,107 | $447,065 | $178,824 | $268,241 |
Source: Public Records
Map
Nearby Homes
- 7025 Bret Harte Dr
- 6898 Shearwater Dr
- 21287 Almaden Rd
- 6698 Charter Oak Place
- 993 Woodview Place
- 6805 Almaden Rd
- 18950 Graystone Ln
- 6803 Lenwood Way
- 1171 Wilhelmina Way
- 6605 Bret Harte Dr
- 1120 Valley Quail Cir
- 1066 Quail Creek Cir
- 1140 Mallard Ridge Loop
- 765 Finchwood Way
- 1128 Foxhurst Way
- 6997 Elwood Rd
- 6628 Wildwood Ct
- 20560 Henwood Rd
- 1122 Hearth Ct
- 7111 Echo Loop
- 1044 Via Valiente
- 1035 Kristen Ct
- 1052 Via Valiente
- 1043 Kristen Ct
- 6902 Bret Harte Dr
- 6914 Bret Harte Dr
- 1042 Bret Knoll Ct
- 1038 Bret Knoll Ct
- 1046 Bret Knoll Ct
- 1034 Bret Knoll Ct
- 1051 Kristen Ct
- 1060 Via Valiente
- 1050 Bret Knoll Ct
- 6920 Bret Harte Dr
- 1054 Bret Knoll Ct
- 1058 Bret Knoll Ct
- 1026 Burlwood Dr
- 1028 Burlwood Dr
- 1022 Burlwood Dr
- 1062 Bret Knoll Ct