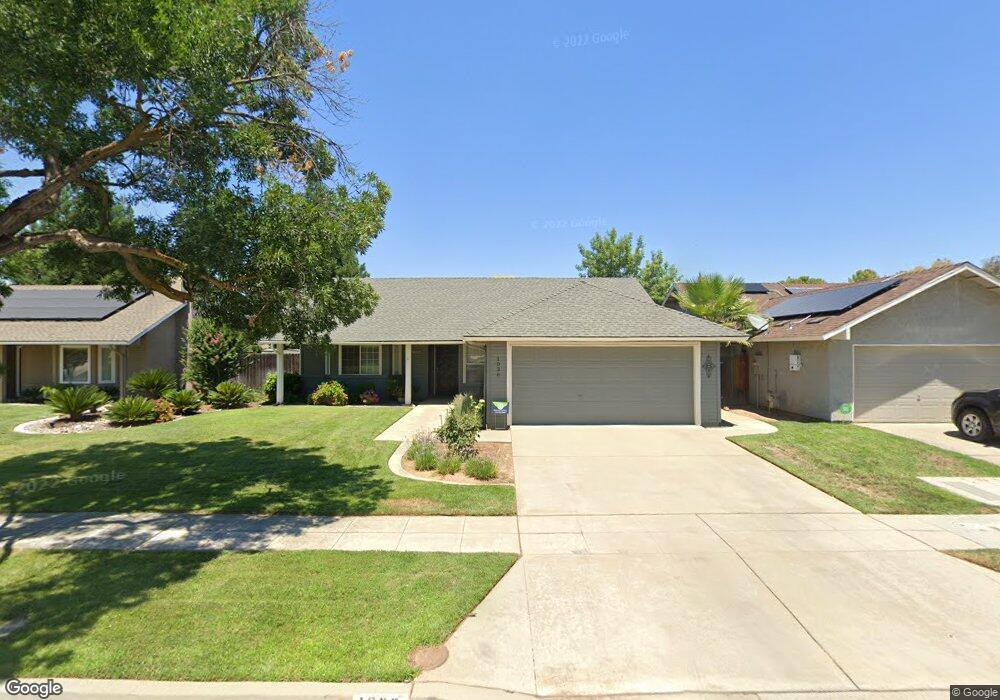
1036 W Minarets Ave Fresno, CA 93650
Bullard NeighborhoodEstimated Value: $282,000 - $398,000
3
Beds
2
Baths
1,327
Sq Ft
$271/Sq Ft
Est. Value
About This Home
This home is located at 1036 W Minarets Ave, Fresno, CA 93650 and is currently estimated at $359,817, approximately $271 per square foot. 1036 W Minarets Ave is a home located in Fresno County with nearby schools including Nelson Elementary School, Kastner Intermediate School, and Clovis West High School.
Ownership History
Date
Name
Owned For
Owner Type
Purchase Details
Closed on
Apr 11, 2005
Sold by
Peoples James Frank and Peoples Joan Benoit
Bought by
Hillman Pamela G
Current Estimated Value
Purchase Details
Closed on
May 21, 2003
Sold by
Peoples James Frank and Peoples Joan Benoit
Bought by
Peoples James Frank and Peoples Joan Benoit
Home Financials for this Owner
Home Financials are based on the most recent Mortgage that was taken out on this home.
Original Mortgage
$74,500
Interest Rate
5.05%
Mortgage Type
Purchase Money Mortgage
Purchase Details
Closed on
Aug 11, 1999
Sold by
Gene Hillman Pamela
Bought by
Benoit Joan and Peoples Joan Benoit
Purchase Details
Closed on
Jun 22, 1999
Sold by
Joan Benoit and Benoit Joan
Bought by
Peoples James Frank and Peoples Joan Benoit
Create a Home Valuation Report for This Property
The Home Valuation Report is an in-depth analysis detailing your home's value as well as a comparison with similar homes in the area
Home Values in the Area
Average Home Value in this Area
Purchase History
| Date | Buyer | Sale Price | Title Company |
|---|---|---|---|
| Hillman Pamela G | -- | -- | |
| Peoples James Frank | -- | Chicago Title Company | |
| Benoit Joan | -- | -- | |
| Peoples James Frank | -- | -- |
Source: Public Records
Mortgage History
| Date | Status | Borrower | Loan Amount |
|---|---|---|---|
| Previous Owner | Peoples James Frank | $74,500 |
Source: Public Records
Tax History Compared to Growth
Tax History
| Year | Tax Paid | Tax Assessment Tax Assessment Total Assessment is a certain percentage of the fair market value that is determined by local assessors to be the total taxable value of land and additions on the property. | Land | Improvement |
|---|---|---|---|---|
| 2025 | $1,810 | $158,197 | $62,539 | $95,658 |
| 2023 | $1,774 | $152,056 | $60,111 | $91,945 |
| 2022 | $1,749 | $149,076 | $58,933 | $90,143 |
| 2021 | $1,699 | $146,154 | $57,778 | $88,376 |
| 2020 | $1,691 | $144,656 | $57,186 | $87,470 |
| 2019 | $1,657 | $141,820 | $56,065 | $85,755 |
| 2018 | $1,619 | $139,040 | $54,966 | $84,074 |
| 2017 | $1,590 | $136,315 | $53,889 | $82,426 |
| 2016 | $1,536 | $133,643 | $52,833 | $80,810 |
| 2015 | $1,511 | $131,637 | $52,040 | $79,597 |
| 2014 | $1,569 | $129,059 | $51,021 | $78,038 |
Source: Public Records
Map
Nearby Homes
- 1067 W Minarets Ave
- 1110 W Bedford Ave
- 7166 N Fruit Ave Unit 160
- 7166 N Fruit Ave Unit 132
- 7166 N Fruit Ave Unit 133
- 7178 N Fruit Ave Unit 108
- 7166 N Fruit Ave Unit 127
- 0 0 Unit 633401
- 0 0 Unit 631266
- 6737 N Harrison Ave
- 1 Palm Ave
- 7355 N Pacific Ave
- 7334 N Teilman Ave
- 744 W Magill Ave
- 6658 N Thorne Ave
- 408 W Spruce Ave
- 6594 N Farris Ave
- 349 W Birch Ave
- 744 W Palo Altp Ave
- 7013 N Maroa Ave
- 1028 W Minarets Ave
- 1046 W Minarets Ave
- 1127 W Pinedale Ave
- 1018 W Minarets Ave
- 1054 W Minarets Ave
- 1119 W Pinedale Ave
- 1139 W Pinedale Ave
- 1113 W Pinedale Ave
- 1147 W Pinedale Ave
- 1041 W Minarets Ave
- 1033 W Minarets Ave
- 1010 W Minarets Ave
- 1021 W Minarets Ave
- 1105 W Pinedale Ave
- 1057 W Minarets Ave
- 1013 W Minarets Ave
- 1076 W Minarets Ave
- 1167 W Pinedale Ave
- 1126 W Pinedale Ave
- 1140 W Birch Ave