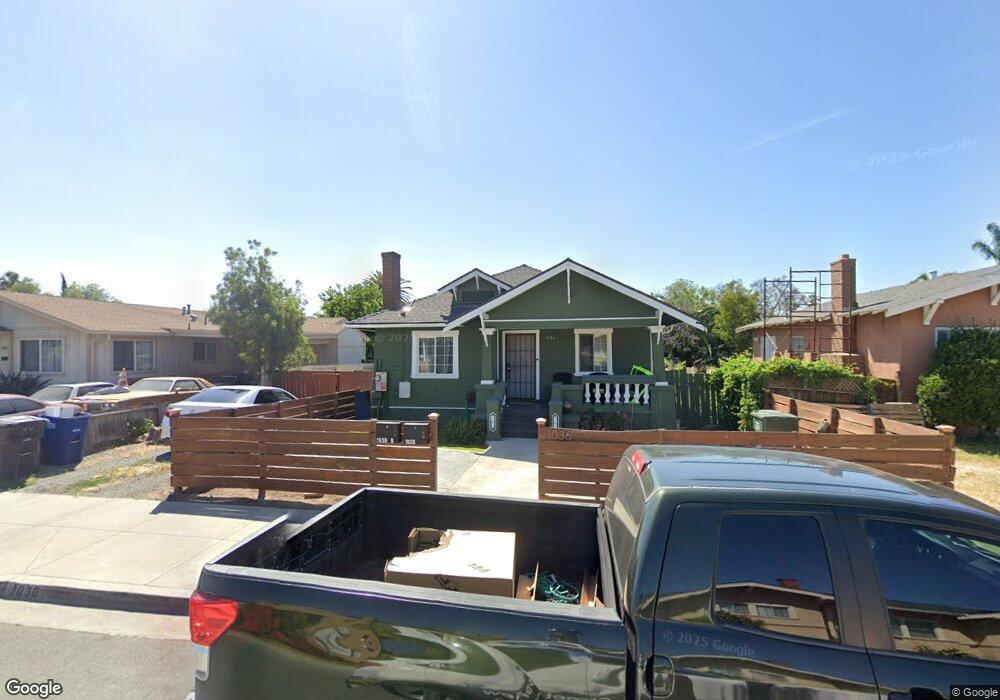
1036 York St Pittsburg, CA 94565
Downtown Pittsburg NeighborhoodEstimated Value: $441,000 - $491,000
2
Beds
1
Bath
959
Sq Ft
$483/Sq Ft
Est. Value
About This Home
This home is located at 1036 York St, Pittsburg, CA 94565 and is currently estimated at $463,108, approximately $482 per square foot. 1036 York St is a home located in Contra Costa County with nearby schools including Marina Vista Elementary School, Martin Luther King Jr. Junior High School, and Pittsburg Senior High School.
Ownership History
Date
Name
Owned For
Owner Type
Purchase Details
Closed on
Oct 31, 2018
Sold by
Kendall Bretta Ann
Bought by
Flores Miguel A and Flores Francisco
Current Estimated Value
Home Financials for this Owner
Home Financials are based on the most recent Mortgage that was taken out on this home.
Original Mortgage
$322,040
Outstanding Balance
$282,006
Interest Rate
4.6%
Mortgage Type
New Conventional
Estimated Equity
$181,102
Purchase Details
Closed on
Mar 15, 2012
Sold by
Kendall Bretta and Kendall Bretta Ann
Bought by
Kendall Bretta Ann
Purchase Details
Closed on
Aug 10, 1995
Sold by
Spencer Darl
Bought by
Kendall Bretta
Home Financials for this Owner
Home Financials are based on the most recent Mortgage that was taken out on this home.
Original Mortgage
$50,350
Interest Rate
7.71%
Mortgage Type
Seller Take Back
Create a Home Valuation Report for This Property
The Home Valuation Report is an in-depth analysis detailing your home's value as well as a comparison with similar homes in the area
Home Values in the Area
Average Home Value in this Area
Purchase History
| Date | Buyer | Sale Price | Title Company |
|---|---|---|---|
| Flores Miguel A | $332,000 | Chicago Title Company | |
| Kendall Bretta Ann | -- | None Available | |
| Kendall Bretta | $40,500 | North American Title Co |
Source: Public Records
Mortgage History
| Date | Status | Borrower | Loan Amount |
|---|---|---|---|
| Open | Flores Miguel A | $322,040 | |
| Previous Owner | Kendall Bretta | $50,350 |
Source: Public Records
Tax History Compared to Growth
Tax History
| Year | Tax Paid | Tax Assessment Tax Assessment Total Assessment is a certain percentage of the fair market value that is determined by local assessors to be the total taxable value of land and additions on the property. | Land | Improvement |
|---|---|---|---|---|
| 2025 | $4,688 | $370,347 | $195,213 | $175,134 |
| 2024 | $4,722 | $363,086 | $191,386 | $171,700 |
| 2023 | $4,722 | $355,968 | $187,634 | $168,334 |
| 2022 | $4,792 | $348,989 | $183,955 | $165,034 |
| 2021 | $4,795 | $342,148 | $180,349 | $161,799 |
| 2019 | $4,573 | $332,000 | $175,000 | $157,000 |
| 2018 | $1,538 | $77,360 | $51,090 | $26,270 |
| 2017 | $1,511 | $75,844 | $50,089 | $25,755 |
| 2016 | $1,350 | $74,357 | $49,107 | $25,250 |
| 2015 | $1,450 | $73,241 | $48,370 | $24,871 |
| 2014 | $1,400 | $71,807 | $47,423 | $24,384 |
Source: Public Records
Map
Nearby Homes
- 301 Central Ave
- 332 E 8th St
- 310 Central Ave
- 175 Halsey Way
- 1037 Gridley Dr
- 340 Cumberland St
- 118 Pelican Loop
- 123 Pelican Loop
- 115 Pelican Loop
- Baxter Plan at Liberty II
- Charlotte Plan at Liberty II
- Daphne Plan at Liberty II
- Aubrey Plan at Liberty II
- 449-451 E 9th St
- 286 Mindy Way
- 278 Mindy Way
- 270 Mindy Way
- 102 Dimaggio Ave
- 262 Mindy Way
- 161 Edgewater Place