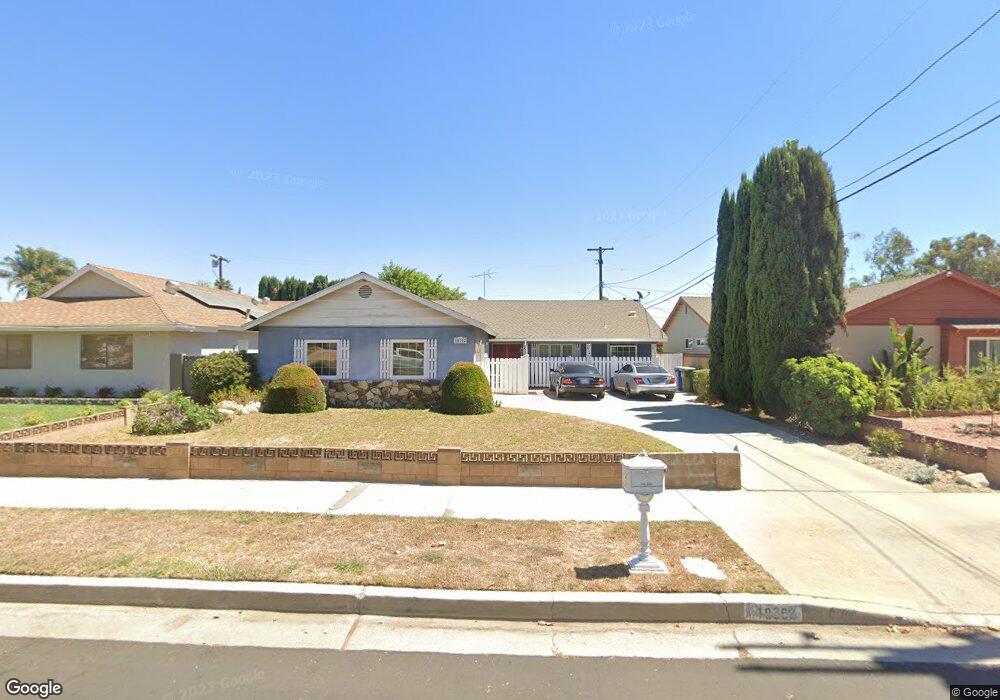
10362 Eton Ave Chatsworth, CA 91311
Estimated Value: $899,948 - $1,175,000
3
Beds
2
Baths
1,753
Sq Ft
$582/Sq Ft
Est. Value
About This Home
This home is located at 10362 Eton Ave, Chatsworth, CA 91311 and is currently estimated at $1,019,487, approximately $581 per square foot. 10362 Eton Ave is a home located in Los Angeles County with nearby schools including Germain Academy For Academic Achievement, Ernest Lawrence Middle School, and Chatsworth Charter High School.
Ownership History
Date
Name
Owned For
Owner Type
Purchase Details
Closed on
Aug 21, 2014
Sold by
The Joseph & Senena Ferris Living Trust
Bought by
Ferris Michael L and Ferris Cheryl R
Current Estimated Value
Home Financials for this Owner
Home Financials are based on the most recent Mortgage that was taken out on this home.
Original Mortgage
$378,750
Outstanding Balance
$286,183
Interest Rate
3.87%
Mortgage Type
Adjustable Rate Mortgage/ARM
Estimated Equity
$733,304
Purchase Details
Closed on
Feb 19, 2007
Sold by
Ferris Joseph T
Bought by
Ferris Thomas and Ferris Senena Sindiong
Purchase Details
Closed on
May 3, 1999
Sold by
Peterson Donald E
Bought by
Ferris Joseph T and Ferris Senena S
Home Financials for this Owner
Home Financials are based on the most recent Mortgage that was taken out on this home.
Original Mortgage
$170,000
Interest Rate
6.84%
Create a Home Valuation Report for This Property
The Home Valuation Report is an in-depth analysis detailing your home's value as well as a comparison with similar homes in the area
Home Values in the Area
Average Home Value in this Area
Purchase History
| Date | Buyer | Sale Price | Title Company |
|---|---|---|---|
| Ferris Michael L | $505,000 | Lawyers Title | |
| Ferris Thomas | -- | None Available | |
| Ferris Joseph T | $213,000 | Chicago Title |
Source: Public Records
Mortgage History
| Date | Status | Borrower | Loan Amount |
|---|---|---|---|
| Open | Ferris Michael L | $378,750 | |
| Previous Owner | Ferris Joseph T | $170,000 |
Source: Public Records
Tax History Compared to Growth
Tax History
| Year | Tax Paid | Tax Assessment Tax Assessment Total Assessment is a certain percentage of the fair market value that is determined by local assessors to be the total taxable value of land and additions on the property. | Land | Improvement |
|---|---|---|---|---|
| 2025 | $7,535 | $606,924 | $402,495 | $204,429 |
| 2024 | $7,535 | $595,024 | $394,603 | $200,421 |
| 2023 | $7,394 | $583,358 | $386,866 | $196,492 |
| 2022 | $7,057 | $571,921 | $379,281 | $192,640 |
| 2021 | $6,967 | $560,708 | $371,845 | $188,863 |
| 2019 | $6,763 | $544,079 | $360,817 | $183,262 |
| 2018 | $6,644 | $533,412 | $353,743 | $179,669 |
| 2016 | $6,345 | $512,701 | $340,007 | $172,694 |
| 2015 | $6,254 | $505,000 | $334,900 | $170,100 |
| 2014 | $3,473 | $271,751 | $198,220 | $73,531 |
Source: Public Records
Map
Nearby Homes
- 10341 Canoga Ave Unit 3
- 10540 Eton Ave
- 10229 Variel Ave Unit 16
- 10215 Variel Ave Unit 11
- 10234 Variel Ave Unit 12
- 10640 Willowbrae Ave
- 21326 Romar St
- 0 Curaco Tr Unit 25-475443
- 10330 Hillview Ave
- 21108 Mayall St
- 10159 De Soto Ave Unit 202
- 21301 Bermuda St
- 0 Canoga Ave
- 10556 Hillview Ave
- 10500 Jordan Ave
- 10501 Oklahoma Ave
- 10220 De Soto Ave Unit 24
- 0 De Soto Unit OC25120663
- 21912 Hiawatha St Unit 2
- 21333 Lassen St Unit 6H
- 10412 Eton Ave
- 10358 Eton Ave
- 10420 Eton Ave
- 10352 Eton Ave
- 10324 Eton Ave
- 10361 Milwood Ave
- 10411 Milwood Ave
- 10359 Milwood Ave
- 21301 Blackhawk St
- 10417 Milwood Ave
- 10353 Milwood Ave
- 10426 Eton Ave
- 10344 Eton Ave
- 21300 Hiawatha St
- 10423 Milwood Ave
- 10345 Milwood Ave
- 10342 Eton Ave
- 10432 Eton Ave
- 21309 Blackhawk St
- 21326 Blackhawk St