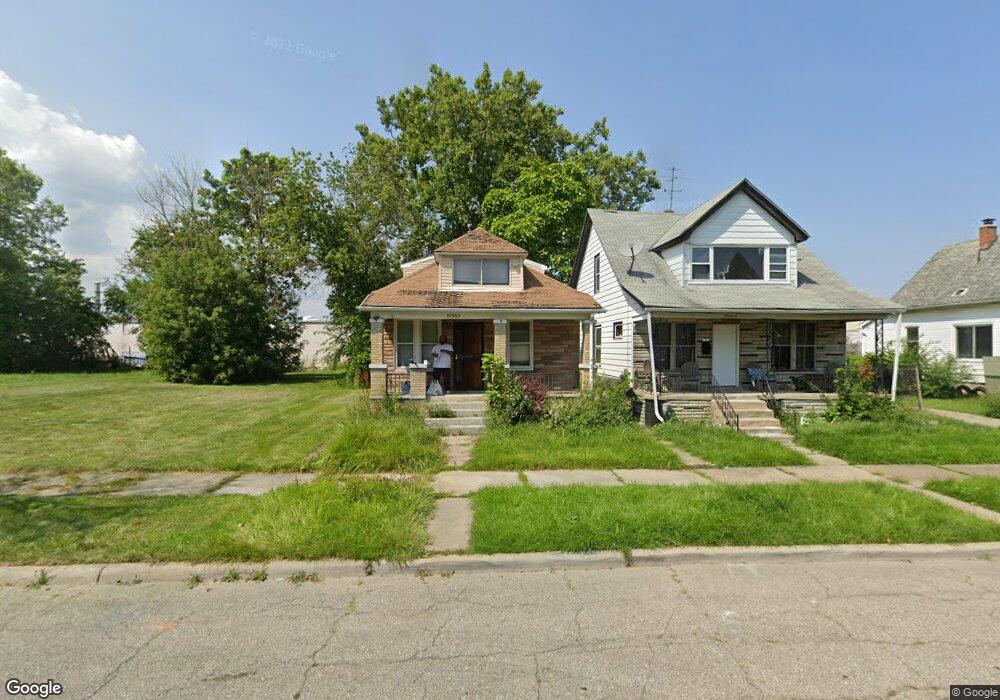
10365 Sterritt St Unit Bldg-Unit Detroit, MI 48213
Estimated Value: $54,000 - $156,456
--
Bed
2
Baths
1,082
Sq Ft
$81/Sq Ft
Est. Value
About This Home
This home is located at 10365 Sterritt St Unit Bldg-Unit, Detroit, MI 48213 and is currently estimated at $87,614, approximately $80 per square foot. 10365 Sterritt St Unit Bldg-Unit is a home located in Wayne County with nearby schools including Edward 'Duke' Ellington Conservatory of Music and Art, Charles L. Spain Elementary-Middle School, and Denby High School.
Ownership History
Date
Name
Owned For
Owner Type
Purchase Details
Closed on
Sep 1, 2023
Sold by
Asm Realty Holdings Llc
Bought by
Detroit Rental Fund 6 Llc
Current Estimated Value
Purchase Details
Closed on
Oct 6, 2022
Sold by
Wayne County Treasurer
Bought by
Asm Realty Holdings Llc
Purchase Details
Closed on
Jun 24, 2019
Sold by
Johnson Barbara J
Bought by
Johnson Barbara J
Purchase Details
Closed on
Jul 7, 2018
Sold by
Leading Edge Properties Llc
Bought by
Martinez Sael Erline and Sael Saulnord Junior
Purchase Details
Closed on
Feb 29, 2016
Sold by
Community Investments Llc
Bought by
Leading Edge Properties Llc
Purchase Details
Closed on
Mar 19, 2015
Sold by
Adams Charlotte A
Bought by
Community Investments Llc
Purchase Details
Closed on
Sep 24, 2007
Sold by
Adams Charlotte L
Bought by
Adams Charlotte L
Create a Home Valuation Report for This Property
The Home Valuation Report is an in-depth analysis detailing your home's value as well as a comparison with similar homes in the area
Home Values in the Area
Average Home Value in this Area
Purchase History
| Date | Buyer | Sale Price | Title Company |
|---|---|---|---|
| Detroit Rental Fund 6 Llc | -- | None Listed On Document | |
| Detroit Rental Fund 6 Llc | -- | None Listed On Document | |
| Asm Realty Holdings Llc | $9,900 | -- | |
| Johnson Barbara J | -- | None Available | |
| Martinez Sael Erline | $3,500 | None Available | |
| Leading Edge Properties Llc | $500 | None Available | |
| Community Investments Llc | $6,200 | Devon Title Agency | |
| Adams Charlotte L | -- | None Available | |
| Adams Charlotte L | -- | None Available |
Source: Public Records
Tax History Compared to Growth
Tax History
| Year | Tax Paid | Tax Assessment Tax Assessment Total Assessment is a certain percentage of the fair market value that is determined by local assessors to be the total taxable value of land and additions on the property. | Land | Improvement |
|---|---|---|---|---|
| 2025 | $1,452 | $19,800 | $0 | $0 |
| 2024 | $1,452 | $18,000 | $0 | $0 |
| 2023 | $1,410 | $15,200 | $0 | $0 |
| 2022 | $1,026 | $11,800 | $0 | $0 |
| 2021 | $999 | $8,700 | $0 | $0 |
| 2020 | $1,054 | $9,200 | $0 | $0 |
| 2019 | $1,098 | $9,700 | $0 | $0 |
| 2018 | $932 | $9,100 | $0 | $0 |
| 2017 | $167 | $8,800 | $0 | $0 |
| 2016 | $338 | $1,300 | $0 | $0 |
| 2015 | $128 | $1,300 | $0 | $0 |
| 2013 | $140 | $1,395 | $0 | $0 |
| 2010 | -- | $2,044 | $401 | $1,643 |
Source: Public Records
Map
Nearby Homes
- 10411 Sterritt St
- 8215 Harper Ave
- 5827 Garland St
- 6015 Pennsylvania St
- 5855 Hurlbut St
- 6023 Cooper St
- 9453 Edgewood St
- 5501 Cadillac Ave
- 5586 Lemay St
- 5554 Lemay St
- 11257 Wade St
- 5561 Pennsylvania St
- 10929 Shoemaker St
- 5565 Fairview St
- 8786 Traverse St
- 11060 Wilshire Dr
- 5137 Saint Clair St
- 6640 Fischer Ave
- 11116 Rosemary St
- 11830 Corbett Ave
- 10365 Sterritt St
- 10357 Sterritt St
- 10369 Sterritt St
- 10425 Sterritt St
- 10417 Sterritt St
- 10347 Sterritt St
- 10335 Sterritt St
- 10341 Sterritt St
- 10437 Sterritt St
- 10321 Sterritt St
- 10410 Sterritt St
- 10327 Sterritt St
- 10416 Sterritt St
- 10422 Sterritt St
- 10449 Sterritt St
- 10309 Sterritt St
- 10434 Sterritt St
- 10428 Sterritt St
- 10440 Sterritt St
- 10455 Sterritt St