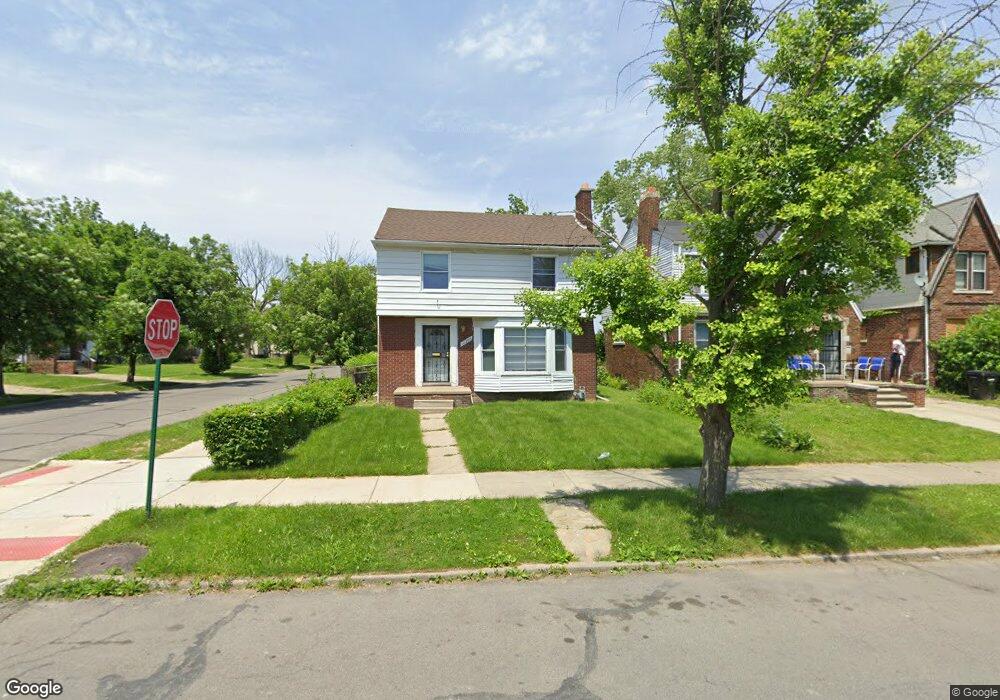
10366 W Point St Detroit, MI 48204
Barton-McFarland NeighborhoodEstimated Value: $67,000 - $126,000
--
Bed
2
Baths
1,332
Sq Ft
$77/Sq Ft
Est. Value
About This Home
This home is located at 10366 W Point St, Detroit, MI 48204 and is currently estimated at $102,984, approximately $77 per square foot. 10366 W Point St is a home located in Wayne County with nearby schools including Bates Academy, Charles L. Spain Elementary-Middle School, and Edward 'Duke' Ellington Conservatory of Music and Art.
Ownership History
Date
Name
Owned For
Owner Type
Purchase Details
Closed on
May 31, 2012
Sold by
Lucas Geneva S
Bought by
Miller Trumilla F
Current Estimated Value
Purchase Details
Closed on
May 22, 2012
Sold by
Wayne County Treasurer
Bought by
Lucas Geneva S
Purchase Details
Closed on
Mar 30, 2009
Sold by
Miller Terence L
Bought by
Miller Trumilla F
Purchase Details
Closed on
May 8, 2007
Sold by
American Home Mortgage Servicing Inc
Bought by
American Home 2007-Sd2 Reo Llc
Purchase Details
Closed on
May 24, 2006
Sold by
Lilledahl Kathleen
Bought by
American Home Mortgage Acceptance Inc
Purchase Details
Closed on
Dec 1, 2005
Sold by
Lilliedahl Kathleen Ann
Bought by
Jethro Investments Llc
Purchase Details
Closed on
Jul 25, 2005
Sold by
First Mortgage Fund Inc
Bought by
Lilledahl Kathleen
Purchase Details
Closed on
May 27, 2004
Sold by
Burris Mary N
Bought by
Ocwen Federal Bank Fsb and Deutsche Bank National Trust Co
Create a Home Valuation Report for This Property
The Home Valuation Report is an in-depth analysis detailing your home's value as well as a comparison with similar homes in the area
Home Values in the Area
Average Home Value in this Area
Purchase History
| Date | Buyer | Sale Price | Title Company |
|---|---|---|---|
| Miller Trumilla F | $500 | None Available | |
| Lucas Geneva S | $500 | None Available | |
| Miller Trumilla F | -- | None Available | |
| American Home 2007-Sd2 Reo Llc | -- | E Title Agency Inc | |
| American Home Mortgage Acceptance Inc | $70,738 | None Available | |
| Jethro Investments Llc | -- | None Available | |
| Lilledahl Kathleen | $120,000 | Exact Title | |
| Ocwen Federal Bank Fsb | $79,980 | -- |
Source: Public Records
Tax History Compared to Growth
Tax History
| Year | Tax Paid | Tax Assessment Tax Assessment Total Assessment is a certain percentage of the fair market value that is determined by local assessors to be the total taxable value of land and additions on the property. | Land | Improvement |
|---|---|---|---|---|
| 2025 | $1,073 | $49,700 | $0 | $0 |
| 2024 | $1,073 | $41,700 | $0 | $0 |
| 2023 | $1,041 | $32,600 | $0 | $0 |
| 2022 | $1,106 | $28,200 | $0 | $0 |
| 2021 | $1,077 | $22,600 | $0 | $0 |
| 2020 | $1,077 | $19,700 | $0 | $0 |
| 2019 | $1,061 | $14,800 | $0 | $0 |
| 2018 | $938 | $14,100 | $0 | $0 |
| 2017 | $168 | $15,500 | $0 | $0 |
| 2016 | $1,023 | $10,300 | $0 | $0 |
| 2015 | $1,030 | $10,300 | $0 | $0 |
| 2013 | $1,442 | $14,415 | $0 | $0 |
| 2010 | -- | $35,200 | $758 | $34,442 |
Source: Public Records
Map
Nearby Homes
- 9225 Birwood St
- 9164 Mendota St
- 9214 Pinehurst St
- 8916 Mendota St
- 9248 Manor St
- 8908 Birwood St
- 9379 Birwood St
- 9375 Mendota St
- 8900 Griggs St
- 9392 Mendota St
- 8875 Manor St
- 9137 Meyers Rd
- 8869 Manor St
- 9379 Manor St
- 9185 Meyers Rd
- 10372 W Chicago
- 8833 Manor St
- 9242 Appoline St
- 9407 Manor St
- 8604 Birwood St
- 10360 W Point St
- 10350 W Point St
- 10350 W Point Ave
- 10344 W Point St
- 10344 W Point Ave
- 10336 W Point St
- 9150 Birwood St
- 9203 Birwood St
- 9233 Birwood St
- 9159 Birwood St
- 10330 W Point St
- 9051 Griggs St
- 9237 Birwood St
- 10322 W Point St
- 9144 Birwood St
- 9151 Birwood St
- 9136 Birwood St
- 9215 Birwood St
- 9145 Birwood St
- 9247 Birwood St