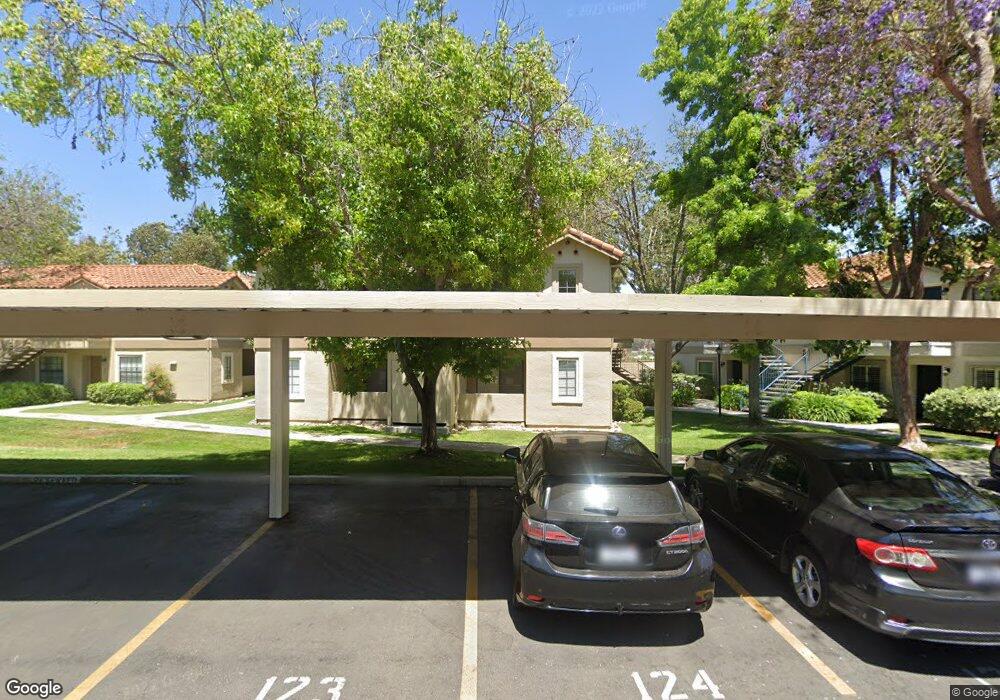
10369 Azuaga St Unit 156 San Diego, CA 92129
Rancho Peñasquitos NeighborhoodEstimated Value: $440,319 - $490,000
1
Bed
1
Bath
600
Sq Ft
$779/Sq Ft
Est. Value
About This Home
This home is located at 10369 Azuaga St Unit 156, San Diego, CA 92129 and is currently estimated at $467,580, approximately $779 per square foot. 10369 Azuaga St Unit 156 is a home located in San Diego County with nearby schools including Los Penasquitos Elementary School, Black Mountain Middle School, and Mt. Carmel High School.
Ownership History
Date
Name
Owned For
Owner Type
Purchase Details
Closed on
Jan 16, 2003
Sold by
Hariri Azim and Hariri Torill Nell
Bought by
The Last San Diego Revocable Family Tr
Current Estimated Value
Purchase Details
Closed on
Jun 5, 2001
Sold by
Cooley Justin H
Bought by
Hariri Azim and Hariri Torill Nell
Home Financials for this Owner
Home Financials are based on the most recent Mortgage that was taken out on this home.
Original Mortgage
$89,000
Outstanding Balance
$33,902
Interest Rate
7.14%
Mortgage Type
Purchase Money Mortgage
Estimated Equity
$433,678
Purchase Details
Closed on
Aug 8, 1998
Sold by
Ybarra Brenda P and Ybarra Brenda P
Bought by
Cooley Justin H
Home Financials for this Owner
Home Financials are based on the most recent Mortgage that was taken out on this home.
Original Mortgage
$69,450
Interest Rate
6.92%
Mortgage Type
Purchase Money Mortgage
Purchase Details
Closed on
Oct 12, 1990
Create a Home Valuation Report for This Property
The Home Valuation Report is an in-depth analysis detailing your home's value as well as a comparison with similar homes in the area
Home Values in the Area
Average Home Value in this Area
Purchase History
| Date | Buyer | Sale Price | Title Company |
|---|---|---|---|
| The Last San Diego Revocable Family Tr | -- | Chicago Title Co | |
| Hariri Azim | $111,500 | California Title Company | |
| Cooley Justin H | $69,500 | Chicago Title Co | |
| Delmastro Brenda P | -- | Chicago Title Co | |
| -- | $78,000 | -- |
Source: Public Records
Mortgage History
| Date | Status | Borrower | Loan Amount |
|---|---|---|---|
| Open | Hariri Azim | $89,000 | |
| Previous Owner | Cooley Justin H | $69,450 |
Source: Public Records
Tax History Compared to Growth
Tax History
| Year | Tax Paid | Tax Assessment Tax Assessment Total Assessment is a certain percentage of the fair market value that is determined by local assessors to be the total taxable value of land and additions on the property. | Land | Improvement |
|---|---|---|---|---|
| 2025 | $1,797 | $167,984 | $70,142 | $97,842 |
| 2024 | $1,797 | $164,691 | $68,767 | $95,924 |
| 2023 | $1,758 | $161,463 | $67,419 | $94,044 |
| 2022 | $1,731 | $158,298 | $66,098 | $92,200 |
| 2021 | $1,699 | $155,195 | $64,802 | $90,393 |
| 2020 | $1,681 | $153,605 | $64,138 | $89,467 |
| 2019 | $1,640 | $150,594 | $62,881 | $87,713 |
| 2018 | $1,595 | $147,643 | $61,649 | $85,994 |
| 2017 | $1,562 | $144,749 | $60,441 | $84,308 |
| 2016 | $1,530 | $141,911 | $59,256 | $82,655 |
| 2015 | $1,508 | $139,780 | $58,366 | $81,414 |
| 2014 | $1,473 | $137,043 | $57,223 | $79,820 |
Source: Public Records
Map
Nearby Homes
- 10379 Azuaga St Unit 139
- 10337 Azuaga St Unit 218
- 10429 Caminito Rimini Unit 64
- 10357 Azuaga St Unit 208
- 10472 Caminito Rimini
- 13749 Caminito Vizzini Unit 73
- 13754 Caminito Vizzini Unit 83
- 10462 Caminito Sulmona
- 10454 Caminito Sulmona
- 13327 Caminito Ciera Unit 61
- 13330 Caminito Ciera Unit 22
- 11020 Via Parma
- 13260 Wimberly Square Unit 240
- 11052 Via San Marco Unit 22
- 14139 Caminito Quevedo
- 13048 Wimberly Square Unit 29
- 13034 Wimberly Square Unit 27
- 10709 Audrey Way
- 13039 Evening Creek Dr S Unit 36
- 14125 Korrey Dr
- 10379 Azuaga St
- 10377 Azuaga St Unit 127
- 10379 Azuaga St Unit 143
- 10377 Azuaga St Unit 122
- 10369 Azuaga St Unit 159
- 10369 Azuaga St Unit 158
- 10369 Azuaga St Unit 157
- 10369 Azuaga St Unit 155
- 10369 Azuaga St Unit 154
- 10369 Azuaga St Unit 153
- 10379 Azuaga St Unit 144
- 10379 Azuaga St Unit 142
- 10379 Azuaga St Unit 141
- 10379 Azuaga St Unit 140
- 10379 Azuaga St Unit 138
- 10379 Azuaga St Unit 137
- 10377 Azuaga St Unit 128
- 10377 Azuaga St Unit 126
- 10377 Azuaga St Unit 125
- 10369 Azuaga St Unit 160