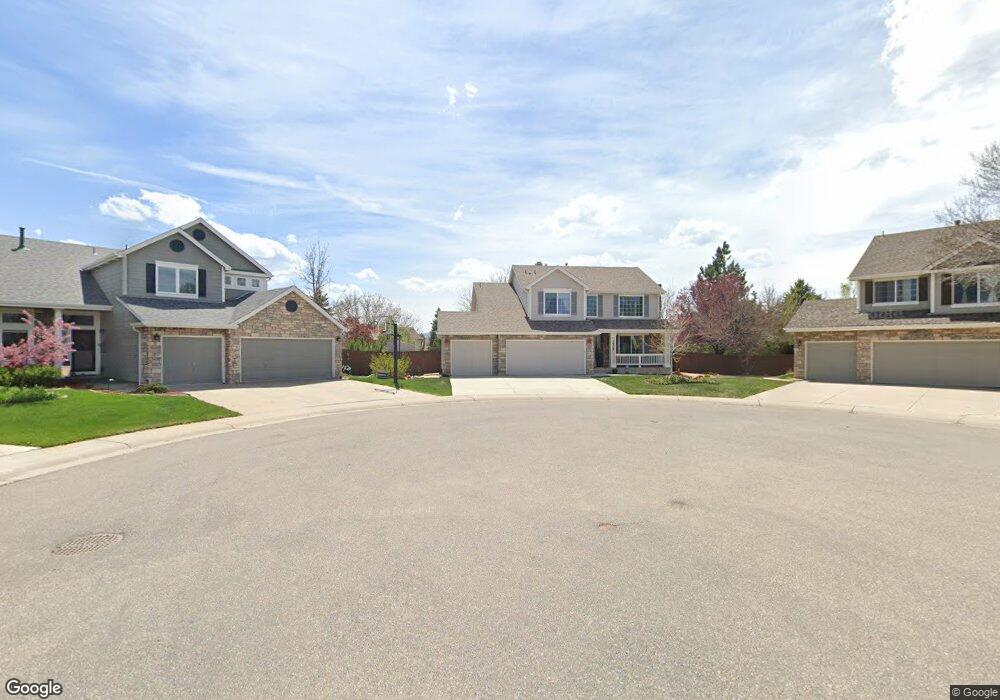
10369 Royal Eagle St Highlands Ranch, CO 80129
Westridge NeighborhoodEstimated Value: $794,007 - $827,000
3
Beds
4
Baths
3,403
Sq Ft
$238/Sq Ft
Est. Value
About This Home
This home is located at 10369 Royal Eagle St, Highlands Ranch, CO 80129 and is currently estimated at $809,002, approximately $237 per square foot. 10369 Royal Eagle St is a home located in Douglas County with nearby schools including Saddle Ranch Elementary School, Ranch View Middle School, and Thunderridge High School.
Ownership History
Date
Name
Owned For
Owner Type
Purchase Details
Closed on
Dec 6, 2023
Sold by
Dixon Robert J and Bernard Mariann
Bought by
Dixon-Bernard Trust
Current Estimated Value
Purchase Details
Closed on
Jul 27, 2012
Sold by
Schwall Edward Brian and Schwall Carole A
Bought by
Dixon Robert J and Bernard Mariann
Home Financials for this Owner
Home Financials are based on the most recent Mortgage that was taken out on this home.
Original Mortgage
$340,862
Interest Rate
3.5%
Mortgage Type
FHA
Purchase Details
Closed on
Jul 14, 1998
Sold by
Engle Homes Colorado Inc
Bought by
Schwall Edward Brian and Schwall Carole A
Home Financials for this Owner
Home Financials are based on the most recent Mortgage that was taken out on this home.
Original Mortgage
$158,800
Interest Rate
6.91%
Purchase Details
Closed on
Mar 27, 1998
Sold by
Shea Homes
Bought by
Engle Homes Colo Inc
Purchase Details
Closed on
Oct 1, 1997
Sold by
Mission Viejo Co
Bought by
Shea Homes
Create a Home Valuation Report for This Property
The Home Valuation Report is an in-depth analysis detailing your home's value as well as a comparison with similar homes in the area
Home Values in the Area
Average Home Value in this Area
Purchase History
| Date | Buyer | Sale Price | Title Company |
|---|---|---|---|
| Dixon-Bernard Trust | -- | None Listed On Document | |
| Dixon Robert J | $370,000 | Land Title Guarantee Company | |
| Schwall Edward Brian | $220,600 | -- | |
| Engle Homes Colo Inc | $435,000 | -- | |
| Shea Homes | -- | -- |
Source: Public Records
Mortgage History
| Date | Status | Borrower | Loan Amount |
|---|---|---|---|
| Previous Owner | Dixon Robert J | $340,862 | |
| Previous Owner | Schwall Edward Brian | $158,800 |
Source: Public Records
Tax History Compared to Growth
Tax History
| Year | Tax Paid | Tax Assessment Tax Assessment Total Assessment is a certain percentage of the fair market value that is determined by local assessors to be the total taxable value of land and additions on the property. | Land | Improvement |
|---|---|---|---|---|
| 2024 | $4,013 | $52,960 | $12,640 | $40,320 |
| 2023 | $4,005 | $52,960 | $12,640 | $40,320 |
| 2022 | $3,473 | $38,010 | $9,150 | $28,860 |
| 2021 | $3,612 | $38,010 | $9,150 | $28,860 |
| 2020 | $3,177 | $34,250 | $6,090 | $28,160 |
| 2019 | $3,188 | $34,250 | $6,090 | $28,160 |
| 2018 | $3,123 | $33,050 | $7,510 | $25,540 |
| 2017 | $2,844 | $33,050 | $7,510 | $25,540 |
| 2016 | $2,756 | $31,430 | $7,680 | $23,750 |
| 2015 | $2,815 | $31,430 | $7,680 | $23,750 |
| 2014 | $2,355 | $24,280 | $4,970 | $19,310 |
Source: Public Records
Map
Nearby Homes
- 1113 Southbury Place
- 664 Tiger Lily Way
- 10544 Soulmark Way
- 978 Sage Sparrow Cir
- 468 English Sparrow Trail
- 885 Sage Sparrow Cir
- 10060 Royal Eagle Ln
- 10414 Maplebrook Way
- 1660 Meyerwood Cir
- 469 Stellars Jay Dr
- 10640 Star Thistle Ct
- 10123 Mockingbird Ln
- 430 Red Thistle Dr
- 380 Rose Finch Cir
- 360 Basilwood Way
- 10785 Sundial Rim Rd
- 1086 Thornbury Place
- 10473 Grizzly Gulch
- 1281 Riddlewood Rd
- 255 Maplehurst Point
- 10359 Royal Eagle St
- 10370 Royal Eagle St
- 10332 Royal Eagle Ln
- 10322 Royal Eagle Ln
- 10349 Royal Eagle St
- 10360 Royal Eagle St
- 10312 Royal Eagle Ln
- 10350 Royal Eagle St
- 797 Shadowstone Dr
- 10340 Royal Eagle St
- 825 Shadowstone Dr
- 10302 Royal Eagle Ln
- 10341 Royal Eagle Ln
- 10339 Royal Eagle St
- 769 Shadowstone Dr
- 851 Shadowstone Dr
- 10330 Royal Eagle St
- 755 Shadowstone Dr
- 10292 Royal Eagle Ln
- 869 Shadowstone Dr