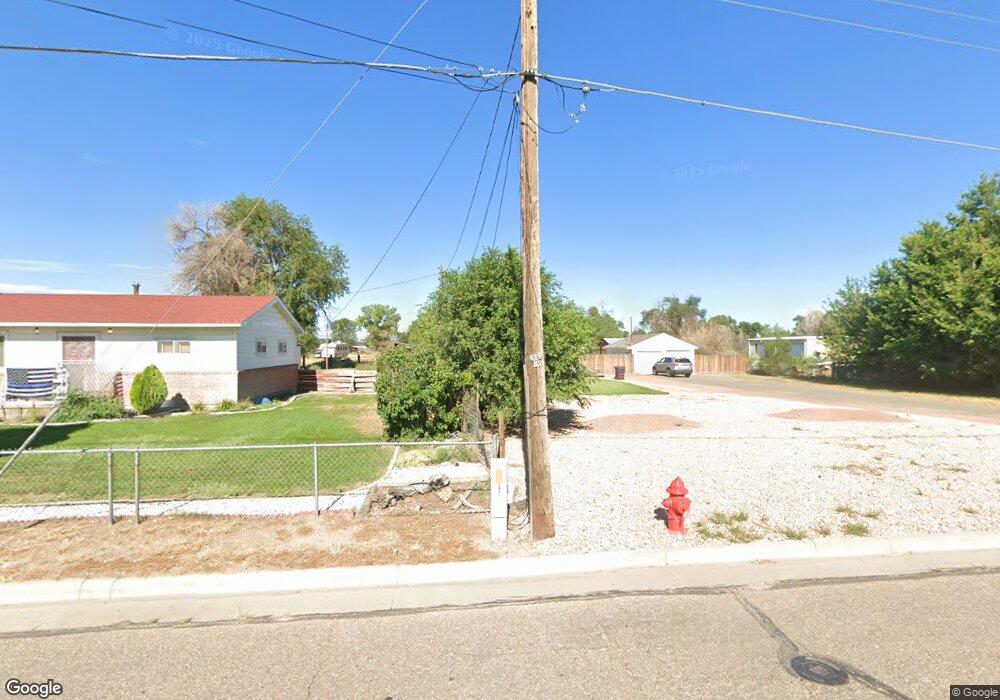
1037 29th Ln Pueblo, CO 81006
Estimated Value: $273,478 - $327,000
2
Beds
1
Bath
1,050
Sq Ft
$292/Sq Ft
Est. Value
About This Home
This home is located at 1037 29th Ln, Pueblo, CO 81006 and is currently estimated at $306,870, approximately $292 per square foot. 1037 29th Ln is a home located in Pueblo County with nearby schools including North Mesa Elementary School, Pleasant View Middle School, and Pueblo County High School.
Ownership History
Date
Name
Owned For
Owner Type
Purchase Details
Closed on
Nov 16, 2011
Sold by
Drury Dwight
Bought by
Dd & D Partners
Current Estimated Value
Purchase Details
Closed on
Aug 10, 2001
Sold by
Quintana Maria
Bought by
Baker Danny J
Purchase Details
Closed on
Aug 8, 2001
Sold by
Quintana Fred A
Bought by
Quintana Maria
Purchase Details
Closed on
Sep 4, 1992
Sold by
Vialpando Randy S +
Bought by
Quintana Fred A
Purchase Details
Closed on
Nov 10, 1986
Sold by
Deherrera Kenneth
Bought by
Vialpando Randy S +
Purchase Details
Closed on
Sep 10, 1986
Sold by
Deherrera Kenneth
Bought by
American Federal S + L Assoc
Purchase Details
Closed on
Apr 3, 1981
Sold by
Otero Robert M
Bought by
Deherrera Kenneth + Regina Bridget
Purchase Details
Closed on
May 3, 1977
Sold by
Goldtrap Gilbert G + Gladys
Bought by
Otero Robert M
Create a Home Valuation Report for This Property
The Home Valuation Report is an in-depth analysis detailing your home's value as well as a comparison with similar homes in the area
Home Values in the Area
Average Home Value in this Area
Purchase History
| Date | Buyer | Sale Price | Title Company |
|---|---|---|---|
| Dd & D Partners | -- | Land Title Guarantee Company | |
| Drury Dwight | $58,500 | Land Title Guarantee Company | |
| Baker Danny J | $88,000 | -- | |
| Quintana Maria | -- | -- | |
| Quintana Fred A | $48,000 | -- | |
| Vialpando Randy S + | $33,500 | -- | |
| American Federal S + L Assoc | $33,500 | -- | |
| Deherrera Kenneth + Regina Bridget | $46,500 | -- | |
| Otero Robert M | -- | -- |
Source: Public Records
Tax History Compared to Growth
Tax History
| Year | Tax Paid | Tax Assessment Tax Assessment Total Assessment is a certain percentage of the fair market value that is determined by local assessors to be the total taxable value of land and additions on the property. | Land | Improvement |
|---|---|---|---|---|
| 2024 | $1,395 | $13,190 | -- | -- |
| 2023 | $1,412 | $16,880 | $3,750 | $13,130 |
| 2022 | $1,433 | $13,570 | $3,020 | $10,550 |
| 2021 | $1,496 | $13,948 | $3,100 | $10,848 |
| 2020 | $1,313 | $12,210 | $2,860 | $9,350 |
| 2019 | $1,288 | $12,208 | $2,860 | $9,348 |
| 2018 | $1,077 | $10,208 | $2,880 | $7,328 |
| 2017 | $1,103 | $10,208 | $2,880 | $7,328 |
| 2016 | $1,124 | $10,389 | $3,184 | $7,205 |
| 2015 | $418 | $7,780 | $3,184 | $4,596 |
| 2014 | $801 | $7,450 | $3,184 | $4,266 |
Source: Public Records
Map
Nearby Homes
- 29380 Windrow Dr
- 945 29th Ln
- 28922 Everett Rd
- 1145 Wago Dr
- 28513 Hillside Rd
- 1040 28th Ln
- TBD Hillside Rd
- 760 28 1 2 Ln
- 27875 County Farm Rd
- 26680 Everett Rd
- 843 Baxter Rd
- 1419 27 1 2 Ln
- 29767 Preston Rd
- 27193 County Farm Rd
- 1470 Villa Spanada St
- 32006 Ford Rd
- 1557 28th Ln
- 27454 Preston Rd
- TBD 27th Ln
- 27111 Preston Rd
- 1041 29th Ln
- 1025 29th Ln
- 28975 Misty Meadows Ln Unit n/a
- 1013 29th Ln
- 1038 29th Ln
- T.B.D> Lane 29 Unit Parc
- 28841 Misty Meadows Ln
- 1020 29th Ln
- 28976 Misty Meadows Ln
- 28812 Gale Rd
- 28958 Gale Rd
- 28902 Gale Rd
- 28850 Misty Meadows Ln
- 28868 Gale Rd
- 1004 29th Ln
- 28810 Gale Rd
- 28705 Misty Meadows Ln
- 28832 Gale Rd
- 28832 Gale Rd Unit 1
- 28806 Gale Rd