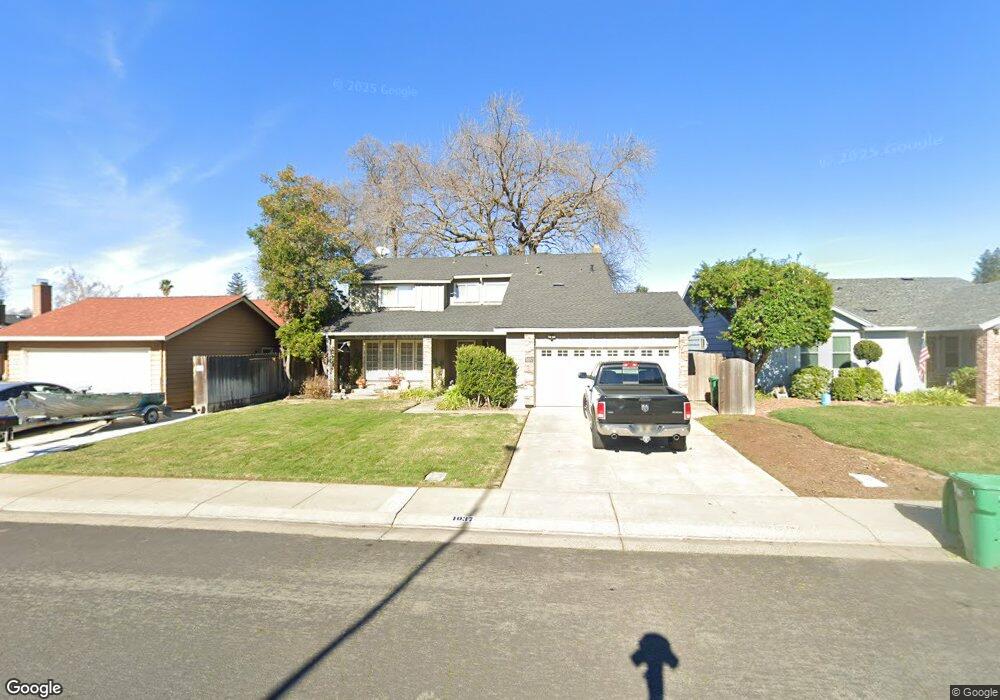
1037 Bradford Cir Lodi, CA 95240
Central Lodi NeighborhoodEstimated Value: $491,561 - $573,000
4
Beds
3
Baths
1,887
Sq Ft
$288/Sq Ft
Est. Value
About This Home
This home is located at 1037 Bradford Cir, Lodi, CA 95240 and is currently estimated at $544,390, approximately $288 per square foot. 1037 Bradford Cir is a home located in San Joaquin County with nearby schools including Beckman Elementary School, Lodi Middle School, and Tokay High School.
Ownership History
Date
Name
Owned For
Owner Type
Purchase Details
Closed on
Dec 28, 2021
Sold by
Harr Bobbie Jo and Harr Bobbie Jo
Bought by
Harr Bobbie Jo
Current Estimated Value
Home Financials for this Owner
Home Financials are based on the most recent Mortgage that was taken out on this home.
Original Mortgage
$315,000
Outstanding Balance
$290,312
Interest Rate
3.11%
Mortgage Type
New Conventional
Estimated Equity
$254,078
Purchase Details
Closed on
Jul 26, 2021
Sold by
Harr Bobbie Jo
Bought by
Harr Bobbie Jo and Harr Revocable Livin Bobbie Jo
Purchase Details
Closed on
May 7, 1996
Sold by
Jacobus Frederic A and Jacobus Nancy
Bought by
Harr Bobbie Jo
Home Financials for this Owner
Home Financials are based on the most recent Mortgage that was taken out on this home.
Original Mortgage
$110,000
Interest Rate
7.96%
Create a Home Valuation Report for This Property
The Home Valuation Report is an in-depth analysis detailing your home's value as well as a comparison with similar homes in the area
Home Values in the Area
Average Home Value in this Area
Purchase History
| Date | Buyer | Sale Price | Title Company |
|---|---|---|---|
| Harr Bobbie Jo | -- | North American Title Co Inc | |
| Harr Bobbie Jo | -- | None Available | |
| Harr Bobbie Jo | $150,000 | Old Republic Title Company |
Source: Public Records
Mortgage History
| Date | Status | Borrower | Loan Amount |
|---|---|---|---|
| Open | Harr Bobbie Jo | $315,000 | |
| Closed | Harr Bobbie Jo | $110,000 |
Source: Public Records
Tax History Compared to Growth
Tax History
| Year | Tax Paid | Tax Assessment Tax Assessment Total Assessment is a certain percentage of the fair market value that is determined by local assessors to be the total taxable value of land and additions on the property. | Land | Improvement |
|---|---|---|---|---|
| 2025 | $2,719 | $249,167 | $83,054 | $166,113 |
| 2024 | $2,645 | $244,282 | $81,426 | $162,856 |
| 2023 | $2,605 | $239,493 | $79,830 | $159,663 |
| 2022 | $2,547 | $234,798 | $78,265 | $156,533 |
| 2021 | $2,594 | $230,195 | $76,731 | $153,464 |
| 2020 | $2,526 | $227,836 | $75,945 | $151,891 |
| 2019 | $2,475 | $223,369 | $74,456 | $148,913 |
| 2018 | $2,441 | $218,991 | $72,997 | $145,994 |
| 2017 | $2,387 | $214,698 | $71,566 | $143,132 |
| 2016 | $2,237 | $210,489 | $70,163 | $140,326 |
| 2014 | $2,110 | $203,268 | $67,756 | $135,512 |
Source: Public Records
Map
Nearby Homes
- 2457 Rockingham Cir
- 1432 Springhaven Way
- 1150 Port Chelsea Cir
- 2260 S Ham Ln
- 712 Mccoy Ct Unit 59
- 700 Mccoy Ct Unit 7
- 872 Dorchester Cir
- 0 E Harney Ln Unit 225091522
- 309 Vineyard Dr
- 1568 Jasmine Way
- 2534 Potomac Way
- 1901 Reisling Dr
- 1311 W Century Blvd Unit 39
- 1311 W Century Blvd Unit 62
- 2321 Monument Dr
- 2154 Meadowbrook Dr
- 2347 Portsmouth Dr
- 1929 Providence Way
- 2340 Goehring Dr
- 2047 Katnich Ln
- 1043 Bradford Cir
- 1031 Bradford Cir
- 1126 Bradford Cir
- 1132 Bradford Cir
- 1120 Bradford Cir
- 1049 Bradford Cir
- 1025 Bradford Cir
- 1009 Bradford Cir
- 1073 Bradford Cir
- 1166 Bradford Cir
- 1079 Bradford Cir
- 1038 Bradford Cir
- 1032 Bradford Cir
- 1044 Bradford Cir
- 1026 Bradford Cir
- 1138 Bradford Cir
- 1114 Bradford Cir
- 1050 Bradford Cir
- 1020 Bradford Cir
- 1111 W Harney Ln