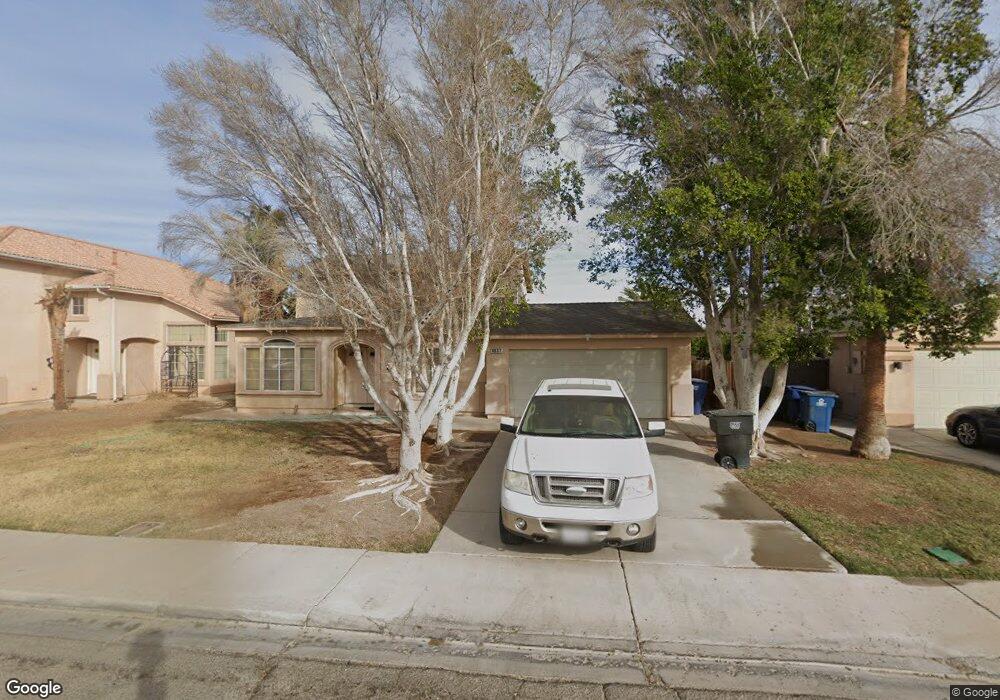
1037 Desert View St Unit 3 Calexico, CA 92231
Estimated Value: $389,576 - $445,000
4
Beds
3
Baths
1,695
Sq Ft
$242/Sq Ft
Est. Value
About This Home
This home is located at 1037 Desert View St Unit 3, Calexico, CA 92231 and is currently estimated at $410,144, approximately $241 per square foot. 1037 Desert View St Unit 3 is a home located in Imperial County with nearby schools including Blanche Charles Elementary School, William Moreno Junior High School, and Calexico High School.
Ownership History
Date
Name
Owned For
Owner Type
Purchase Details
Closed on
Sep 23, 2015
Sold by
Tan Xin Long
Bought by
Tan Muykey Chong
Current Estimated Value
Purchase Details
Closed on
Jul 19, 2011
Sold by
Chong Xin Ru
Bought by
Tan Xin Long
Purchase Details
Closed on
Jun 26, 2002
Sold by
Dechong Xin Ru Tan
Bought by
Chong Xin Ru
Home Financials for this Owner
Home Financials are based on the most recent Mortgage that was taken out on this home.
Original Mortgage
$100,000
Interest Rate
6.78%
Purchase Details
Closed on
Jan 20, 2000
Sold by
Qui Andres Chong
Bought by
Dechong Xin Ru Tan
Purchase Details
Closed on
Jan 18, 2000
Sold by
Martinez L and Martinez S
Bought by
Martinez G Hector M and Martinez Maria Guadalupe
Create a Home Valuation Report for This Property
The Home Valuation Report is an in-depth analysis detailing your home's value as well as a comparison with similar homes in the area
Home Values in the Area
Average Home Value in this Area
Purchase History
| Date | Buyer | Sale Price | Title Company |
|---|---|---|---|
| Tan Muykey Chong | -- | None Available | |
| Tan Xin Long | $105,500 | Orange Coast Title Company | |
| Chong Xin Ru | -- | Commonwealth Land Title Co | |
| Dechong Xin Ru Tan | -- | First American Title Ins Co | |
| Dechong Xin Ru Tan | $125,000 | First American Title Ins Co | |
| Martinez G Hector M | -- | First American Title Ins Co |
Source: Public Records
Mortgage History
| Date | Status | Borrower | Loan Amount |
|---|---|---|---|
| Previous Owner | Chong Xin Ru | $100,000 |
Source: Public Records
Tax History Compared to Growth
Tax History
| Year | Tax Paid | Tax Assessment Tax Assessment Total Assessment is a certain percentage of the fair market value that is determined by local assessors to be the total taxable value of land and additions on the property. | Land | Improvement |
|---|---|---|---|---|
| 2025 | $2,618 | $215,443 | $41,429 | $174,014 |
| 2023 | $2,618 | $207,078 | $39,821 | $167,257 |
| 2022 | $2,535 | $203,019 | $39,041 | $163,978 |
| 2021 | $2,461 | $199,039 | $38,276 | $160,763 |
| 2020 | $2,370 | $196,999 | $37,884 | $159,115 |
| 2019 | $2,301 | $193,138 | $37,142 | $155,996 |
| 2018 | $2,280 | $189,352 | $36,414 | $152,938 |
| 2017 | $2,115 | $185,640 | $35,700 | $149,940 |
| 2016 | $2,018 | $182,000 | $35,000 | $147,000 |
| 2015 | $1,146 | $110,256 | $20,901 | $89,355 |
| 2014 | $1,117 | $108,097 | $20,492 | $87,605 |
Source: Public Records
Map
Nearby Homes
- 1049 Horizon St
- 964 Nosotros St
- 904 Salvador Guilin St
- 1324 River Dr
- 530 W Birch St
- 937 Lacy Ave
- 0 Sec Carr Rd & Rood Rd Unit 24358721IC
- 0 Beech Canal Gate 15 Unit 24368695IC
- 1119 Imperial Ave W
- 38 Las Flores Dr
- 105 John Kennedy St
- 21 E 7th St
- 631 Paulin Ave
- 1 Towncenter Blvd & Sunset Blvd Blvd
- 0 Towncenter Blvd & Sunset Blvd Unit 1 250029404
- 0 California 98
- 1245 C N Perry Rd
- 1214 C N Perry Rd
- 0 Towncenter Way Unit 23248273IC
- 0 Towncenter Way Unit 23248257IC
- 1033 Desert View St
- 1041 Desert View St
- 1036 Skyline St
- 1032 Skyline St
- 1040 Skyline St
- 1045 Desert View St
- 1029 Desert View St
- 1028 Skyline St
- 1044 Skyline St
- 1036 Desert View St
- 1040 Desert View St
- 1032 Desert View St
- 1049 Desert View St
- 1025 Desert View St
- 1044 Desert View St
- 1028 Desert View St
- 1024 Skyline St
- 1128 Rainbow Ave
- 1132 Rainbow Ave
- 1048 Desert View St